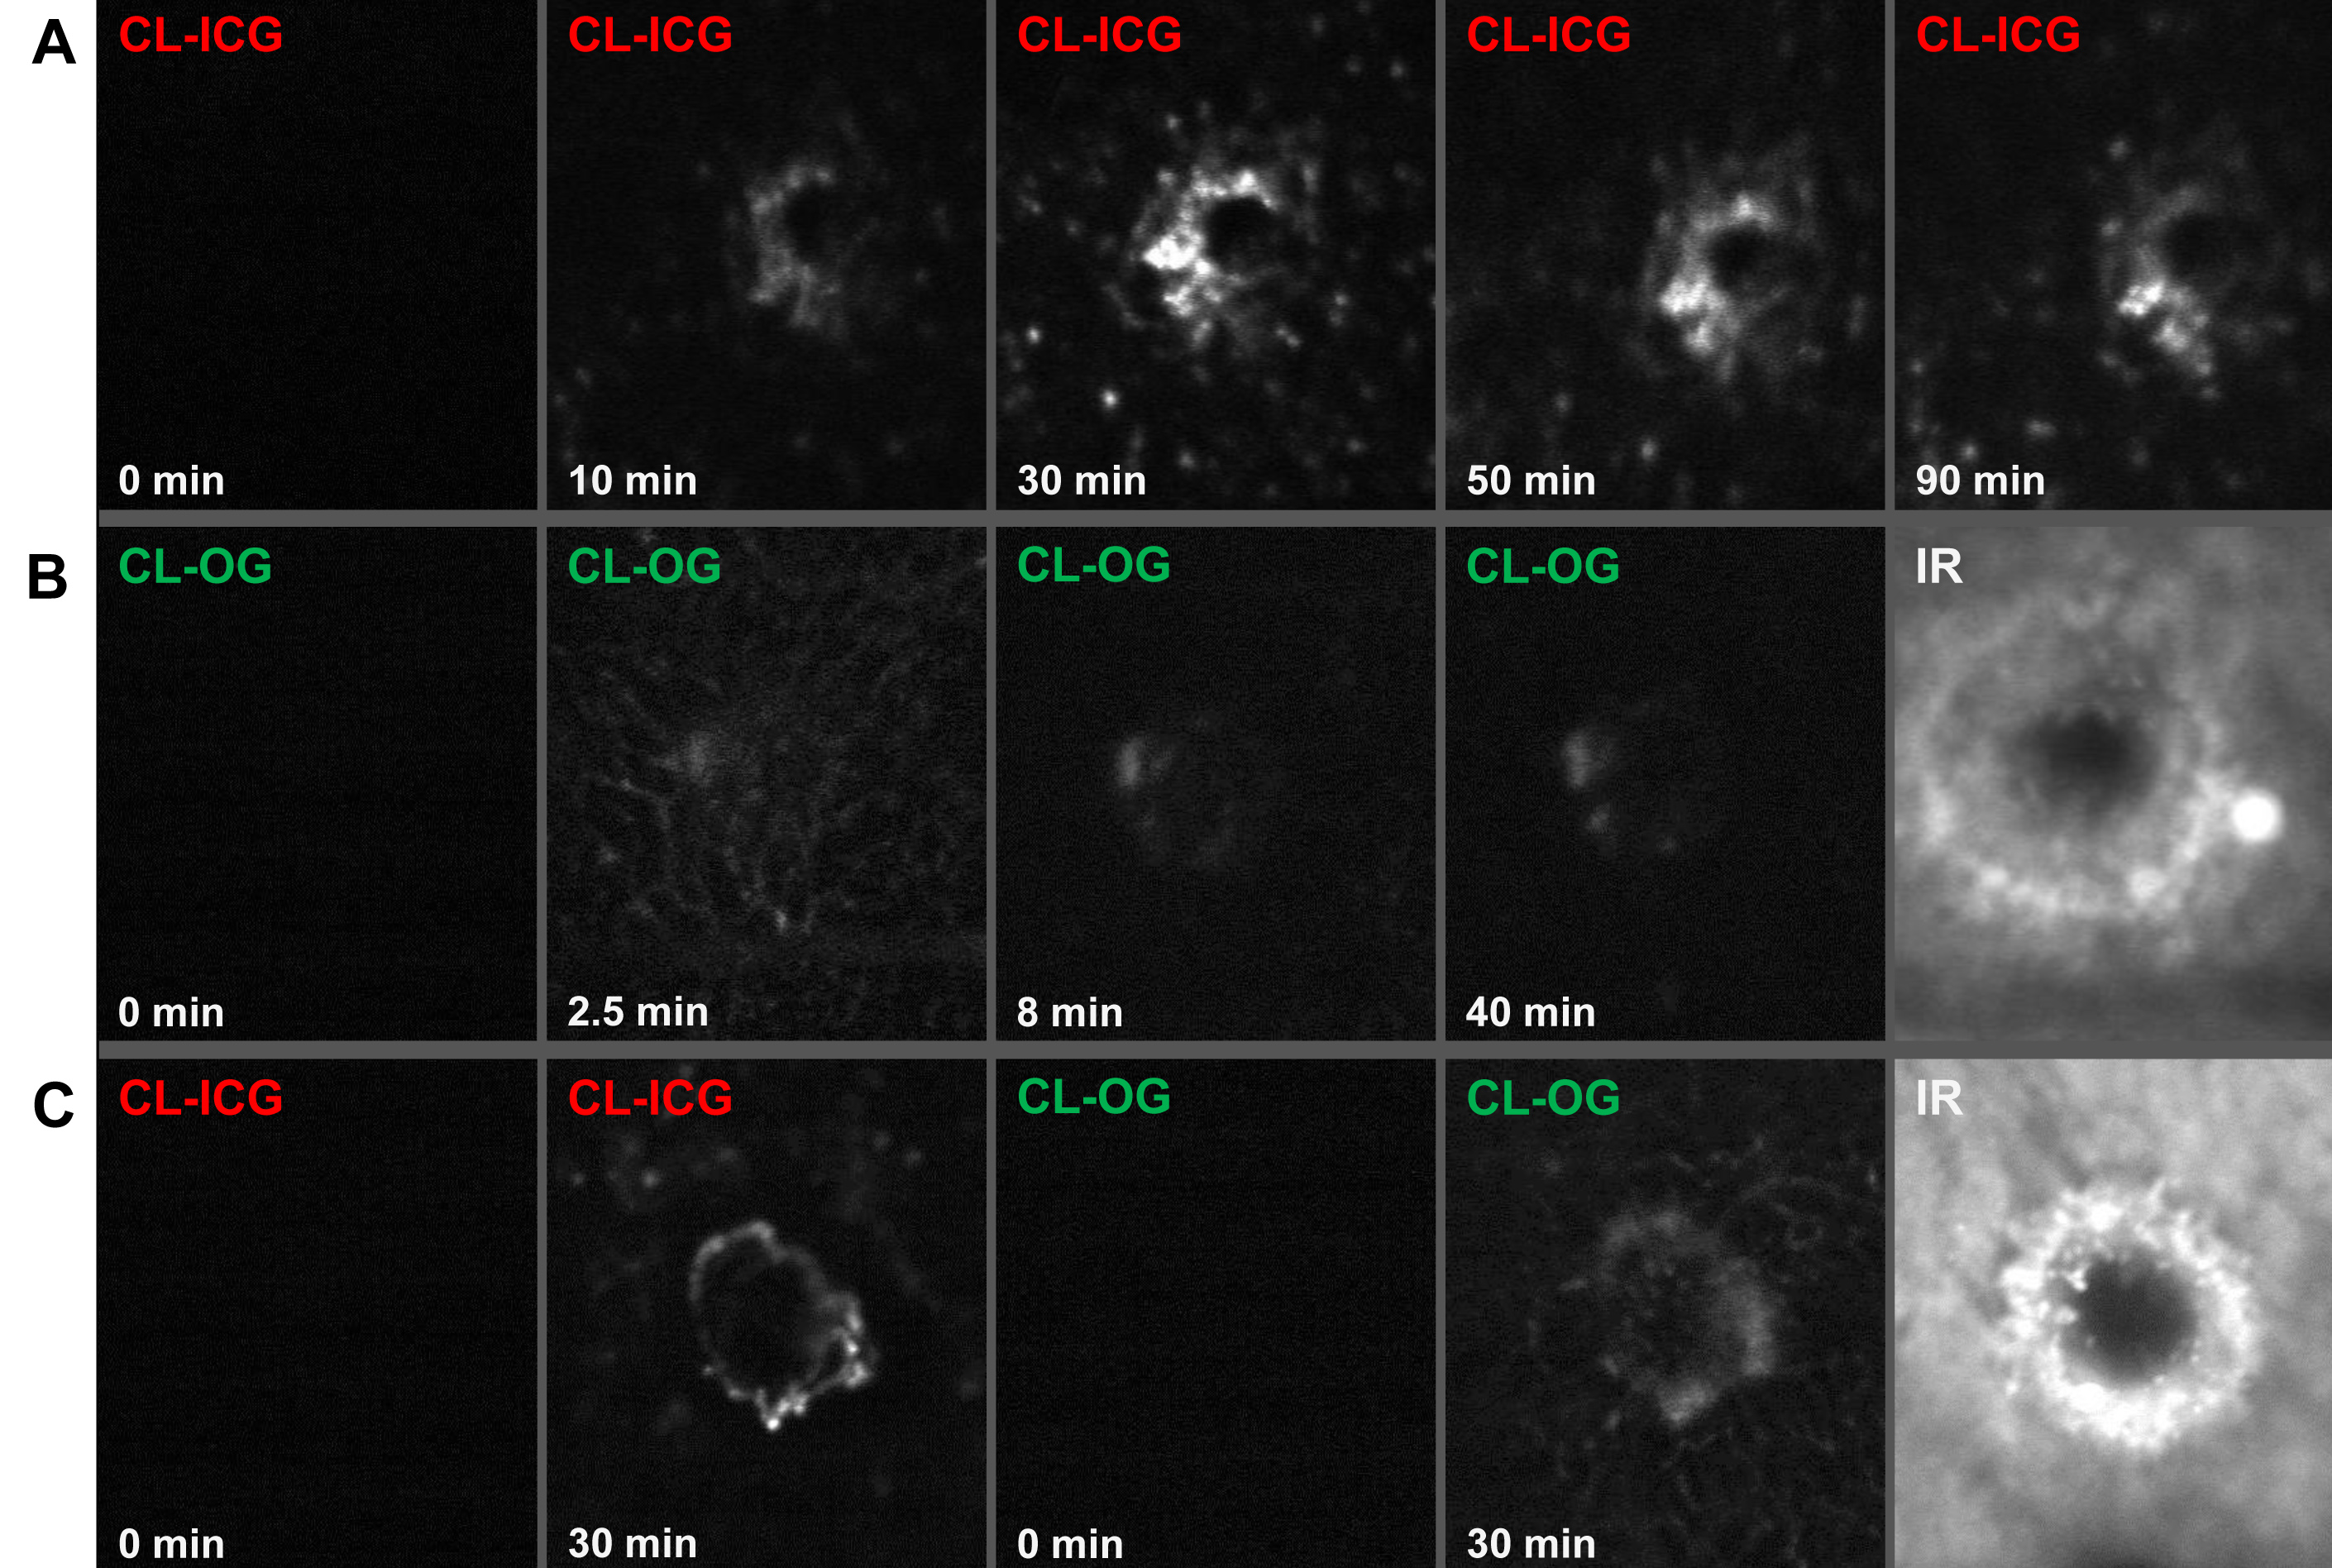
Figure 2. Kinetics of accumulation of
cationic liposomes (CL)- indocyanine green (ICG) or CL-Oregon
green (OG) was observed with the SLO in vivo.
A: ICG-CL
were injected at d14, and scanning laser ophthalmoscope (SLO)
images were recorded in a single choroidal neovascularization
(CNV). While images taken before injection of ICG (0 min) showed
no signal, the ICG fluorescence (795 nm excitation, 830 nm
emission) became detectable in the CNV after 10 min. Maximal
intensity was observed between 30 min and 90 min with a slow
decrease afterwards. Other parts of the fundus were not
specifically stained.
B: OG-CL were injected at d10, and
SLO images were recorded in a single CNV. This series shows the
early signal in the capillaries 2–3 min after injection that
disappears quickly [
8]
while the OG-CL signal in the CNV is coming up later and for a
longer time as shown in
A.
C: ICG-CL (40%) and
CL-OG were mixed and injected at d14, and SLO images were
recorded in a single CNV. Note that the OG signal is somewhat
weaker. IR: CNV lesion in infrared modus.
 Figure 2
of Hua, Mol Vis 2012; 18:1045-1054.
Figure 2
of Hua, Mol Vis 2012; 18:1045-1054.