Figure 2 of
Hu, Mol Vis 2012; 18:87-91.
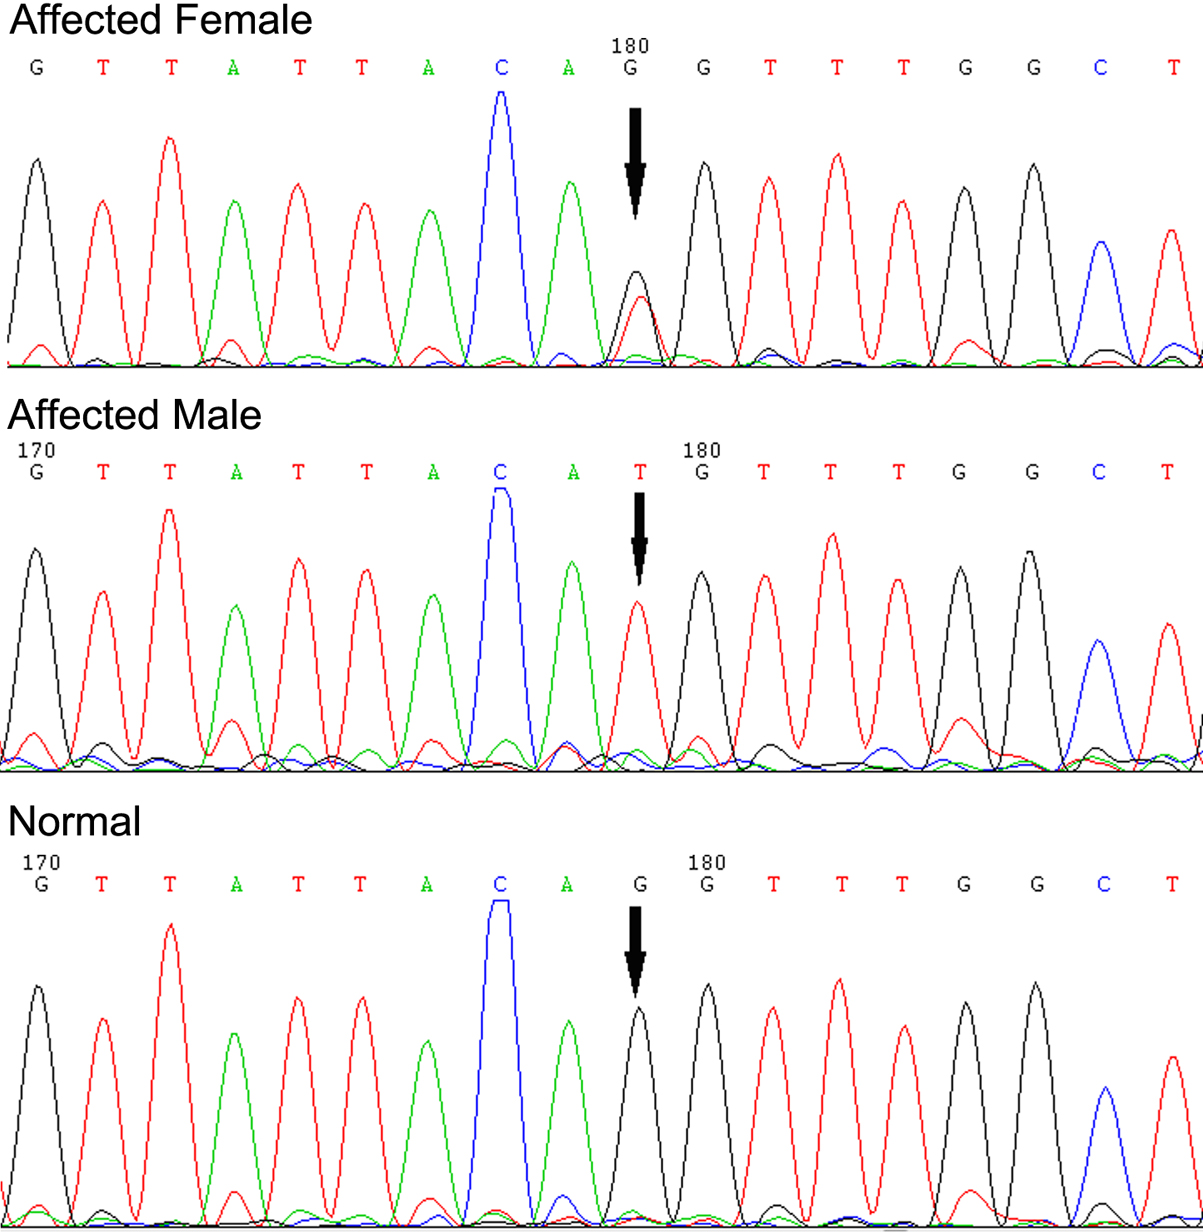
Figure 2.
Sequence analysis of
FRMD7
. Sequencing chromatograms are from an affected female patient (top), an affected male (middle), and a normal individual (bottom), showing the c.163–1 G→T transversion.
 Figure 2
of Hu, Mol Vis 2012; 18:87-91.
Figure 2
of Hu, Mol Vis 2012; 18:87-91.