Figure 5. Plot of the amplitudes of
the a-waves, b-waves, and the implicit time of the a-waves,
b-waves, the potentials at 70ms after the stimulus turns on, and
the time of the recovery of b-wave to the baseline for normal
controls. There were 25 men and 21 women whose age ranged from
23 to 60 years (mean, 38.04±8.33 years) in this control group.
The boxes represent the 95% confidence interval ranges, the
horizontal line represents mean values, and the bars represent
standard deviation. Data recorded from this case are plotted at
indicated mark.
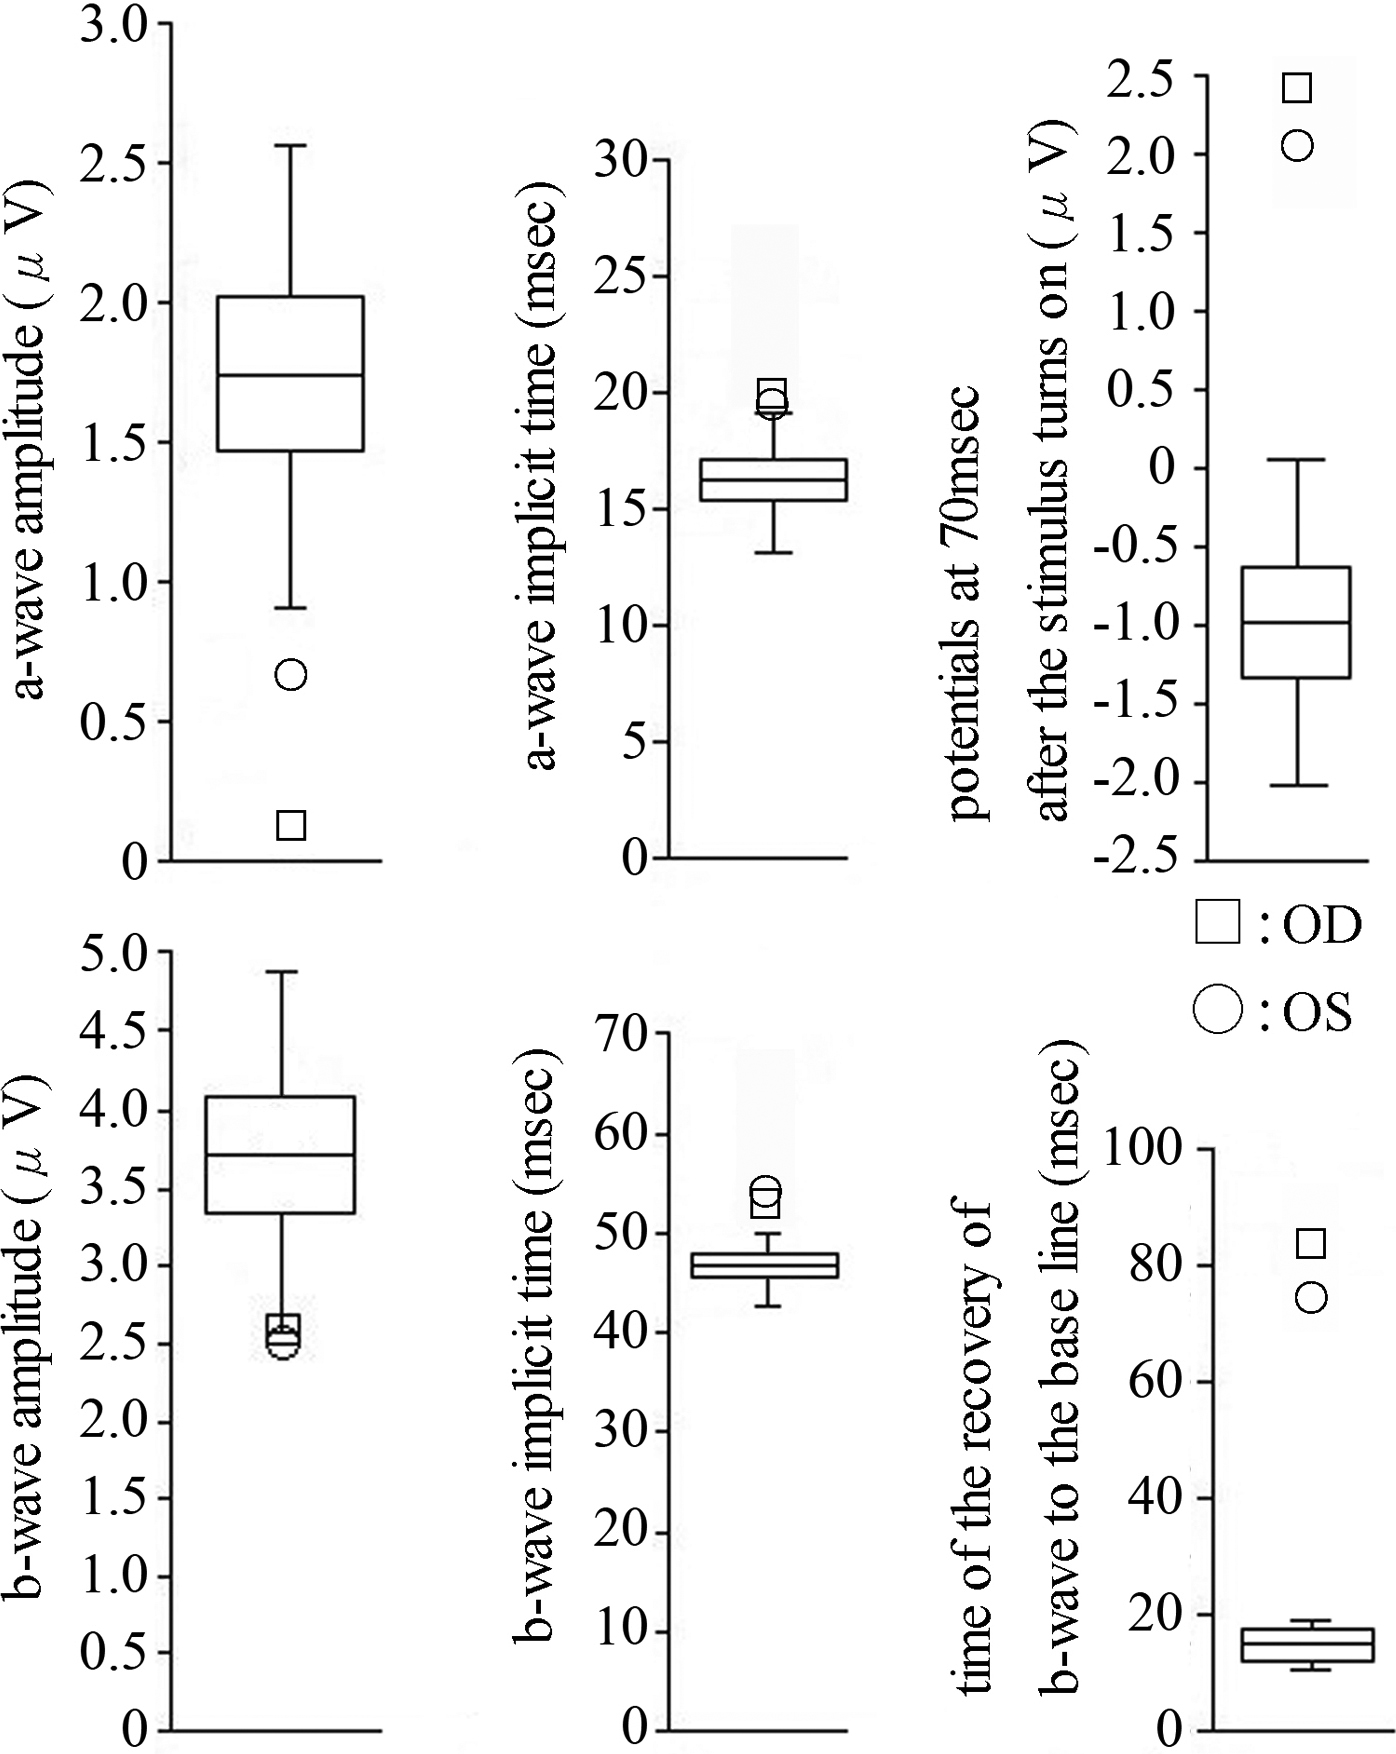
 Figure 5
of Kabuto, Mol Vis 2012; 18:1031-1039.
Figure 5
of Kabuto, Mol Vis 2012; 18:1031-1039.