Figure 4. Results of focal macular
electroretinograms (ERGs) and multifocal ERGs. Focal macular
ERGs and oscillatory potentials recorded from a normal subject
and this case are shown (top). The amplitude of the a-wave of
this case was severely reduced, and the plateau region was
significantly elevated (arrows). The topographic map and the
local responses of multifocal ERGs recorded from the normal
subject and this case are shown (bottom). The amplitudes in the
foveal area were severely reduced in this case.
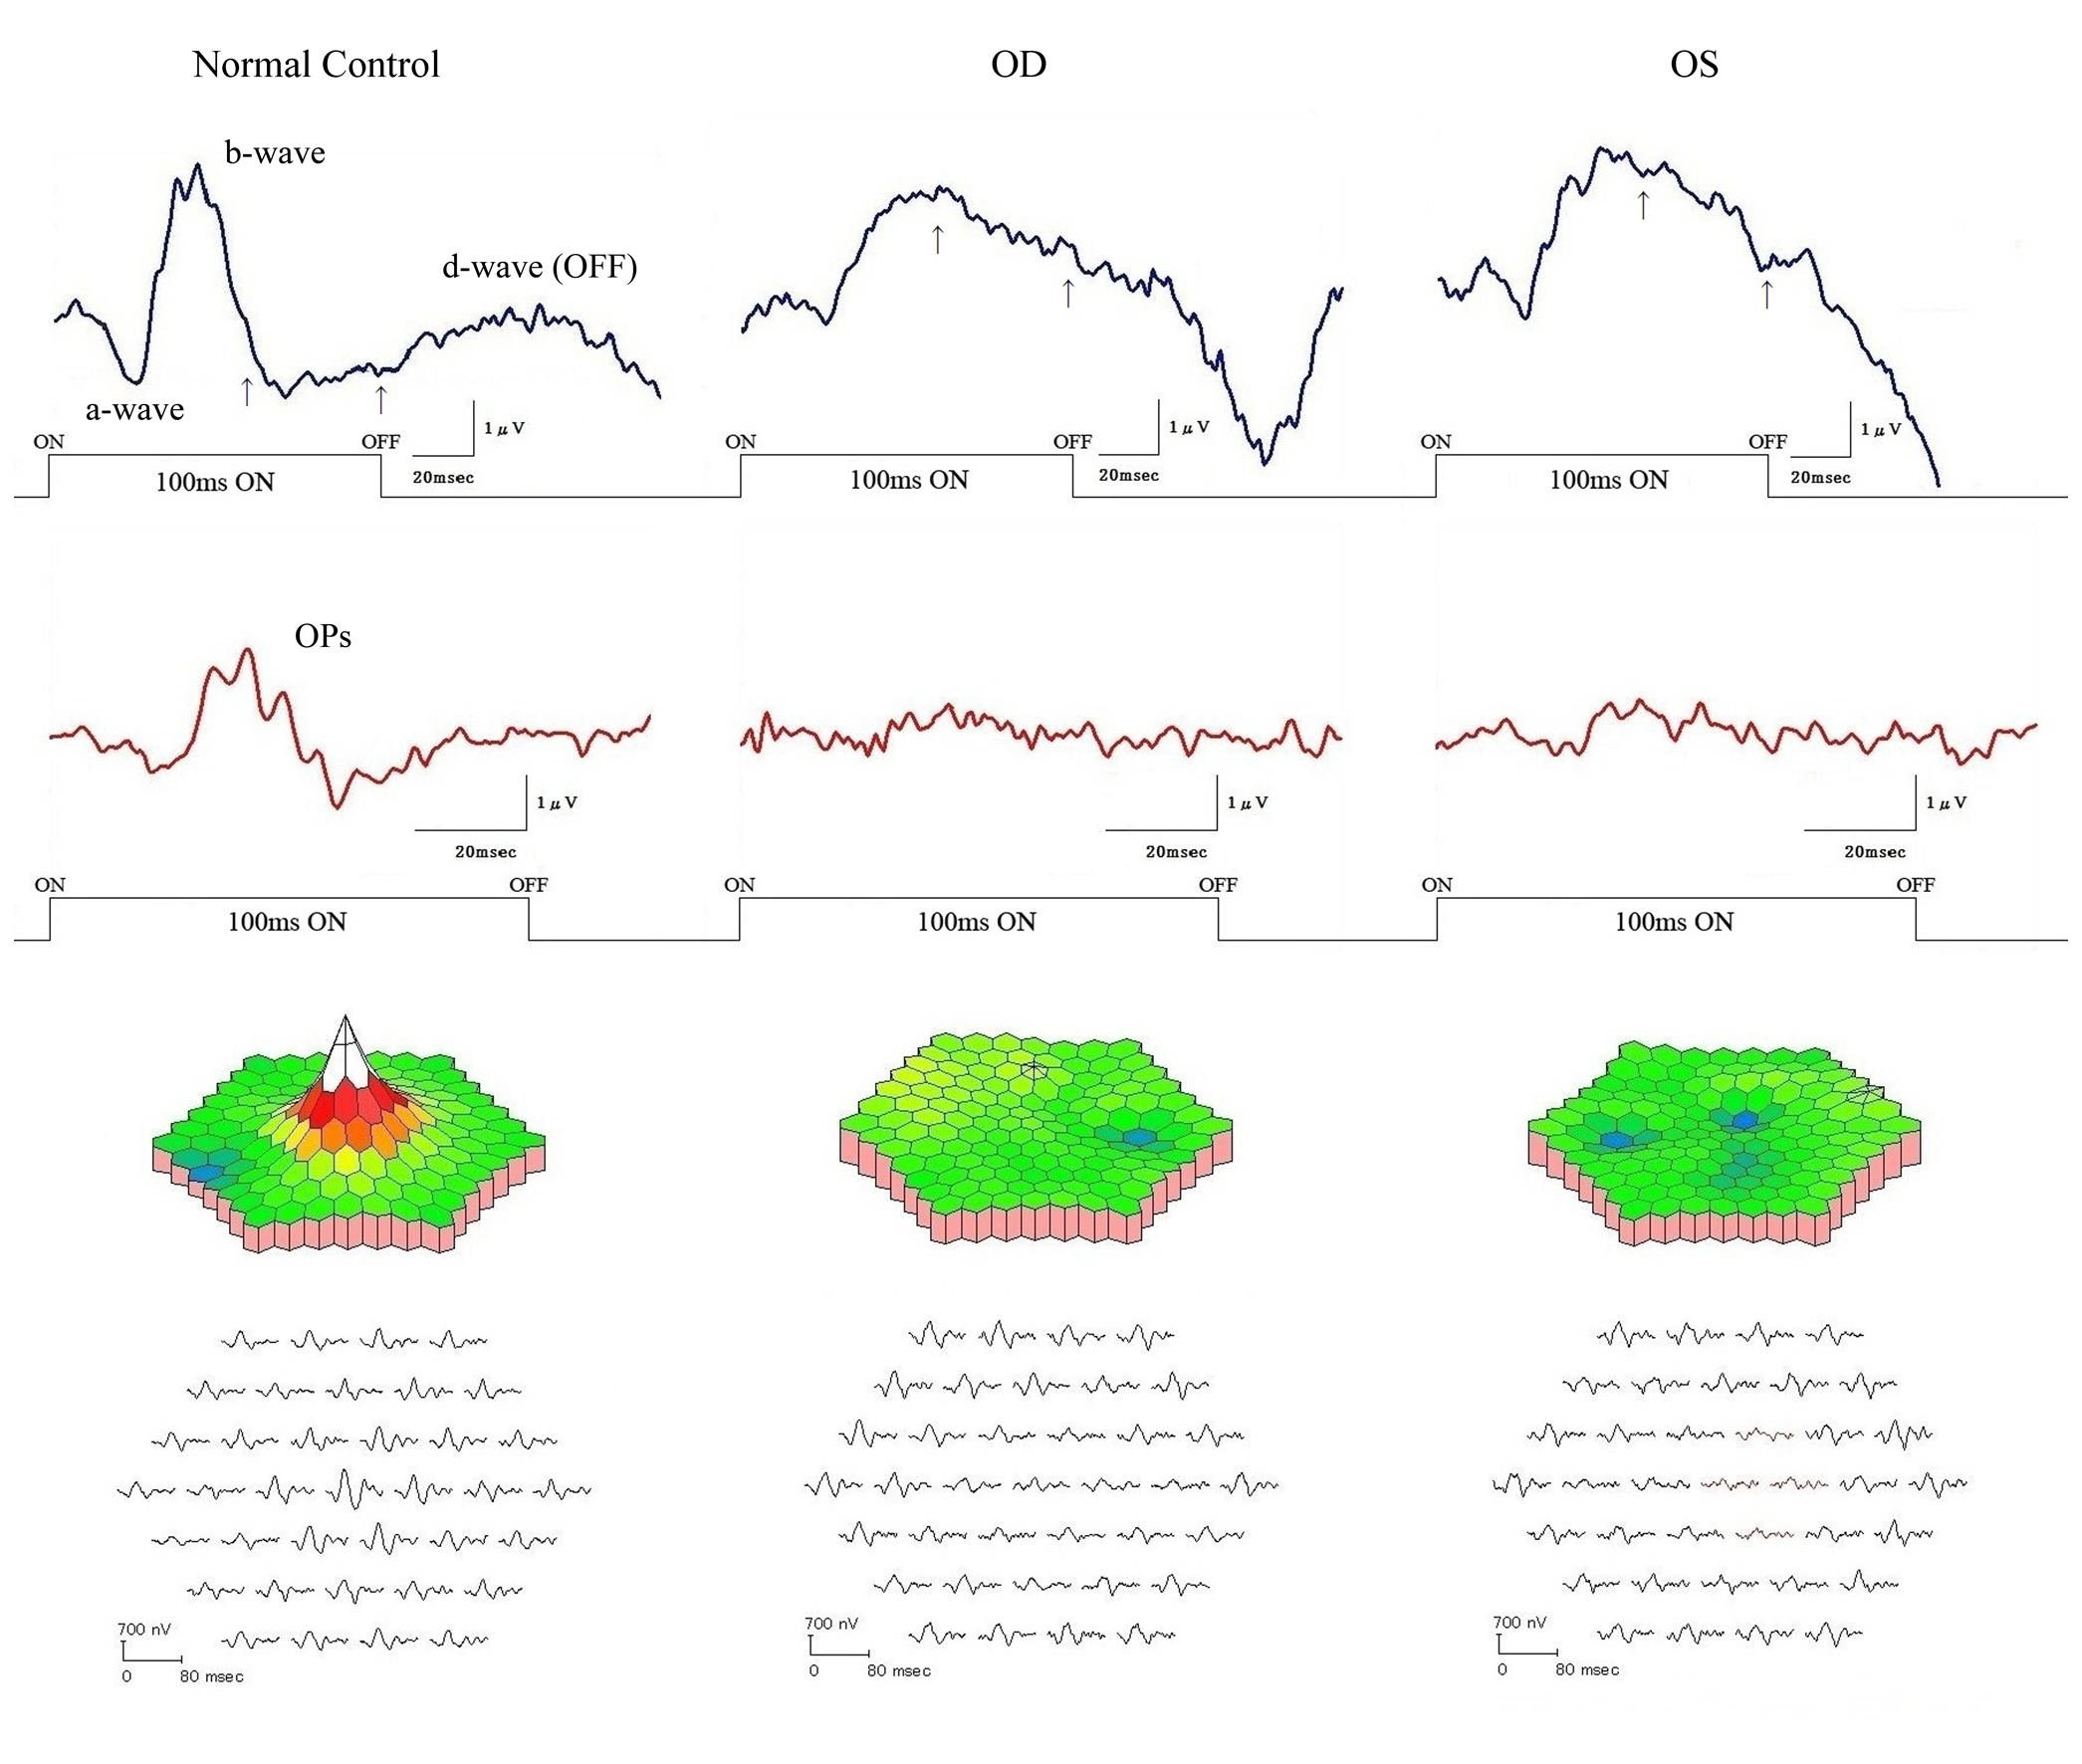
 Figure 4
of Kabuto, Mol Vis 2012; 18:1031-1039.
Figure 4
of Kabuto, Mol Vis 2012; 18:1031-1039.