Figure 3. Spectral-domain optical
coherence tomography (SD-OCT) findings of the eyes in normal
controls (A, B) and in this case (C-F).
Images from right eyes (C, D) and left eyes (E,
F) are shown. Images at lower magnification (A, C,
E) and higher magnification (B, D, F)
are shown. The SD-OCT findings for the eyes in this case show
obvious blurring of the IS/OS junction and the COST line. The
COST line disappeared in the peripheral macula area in this
case.
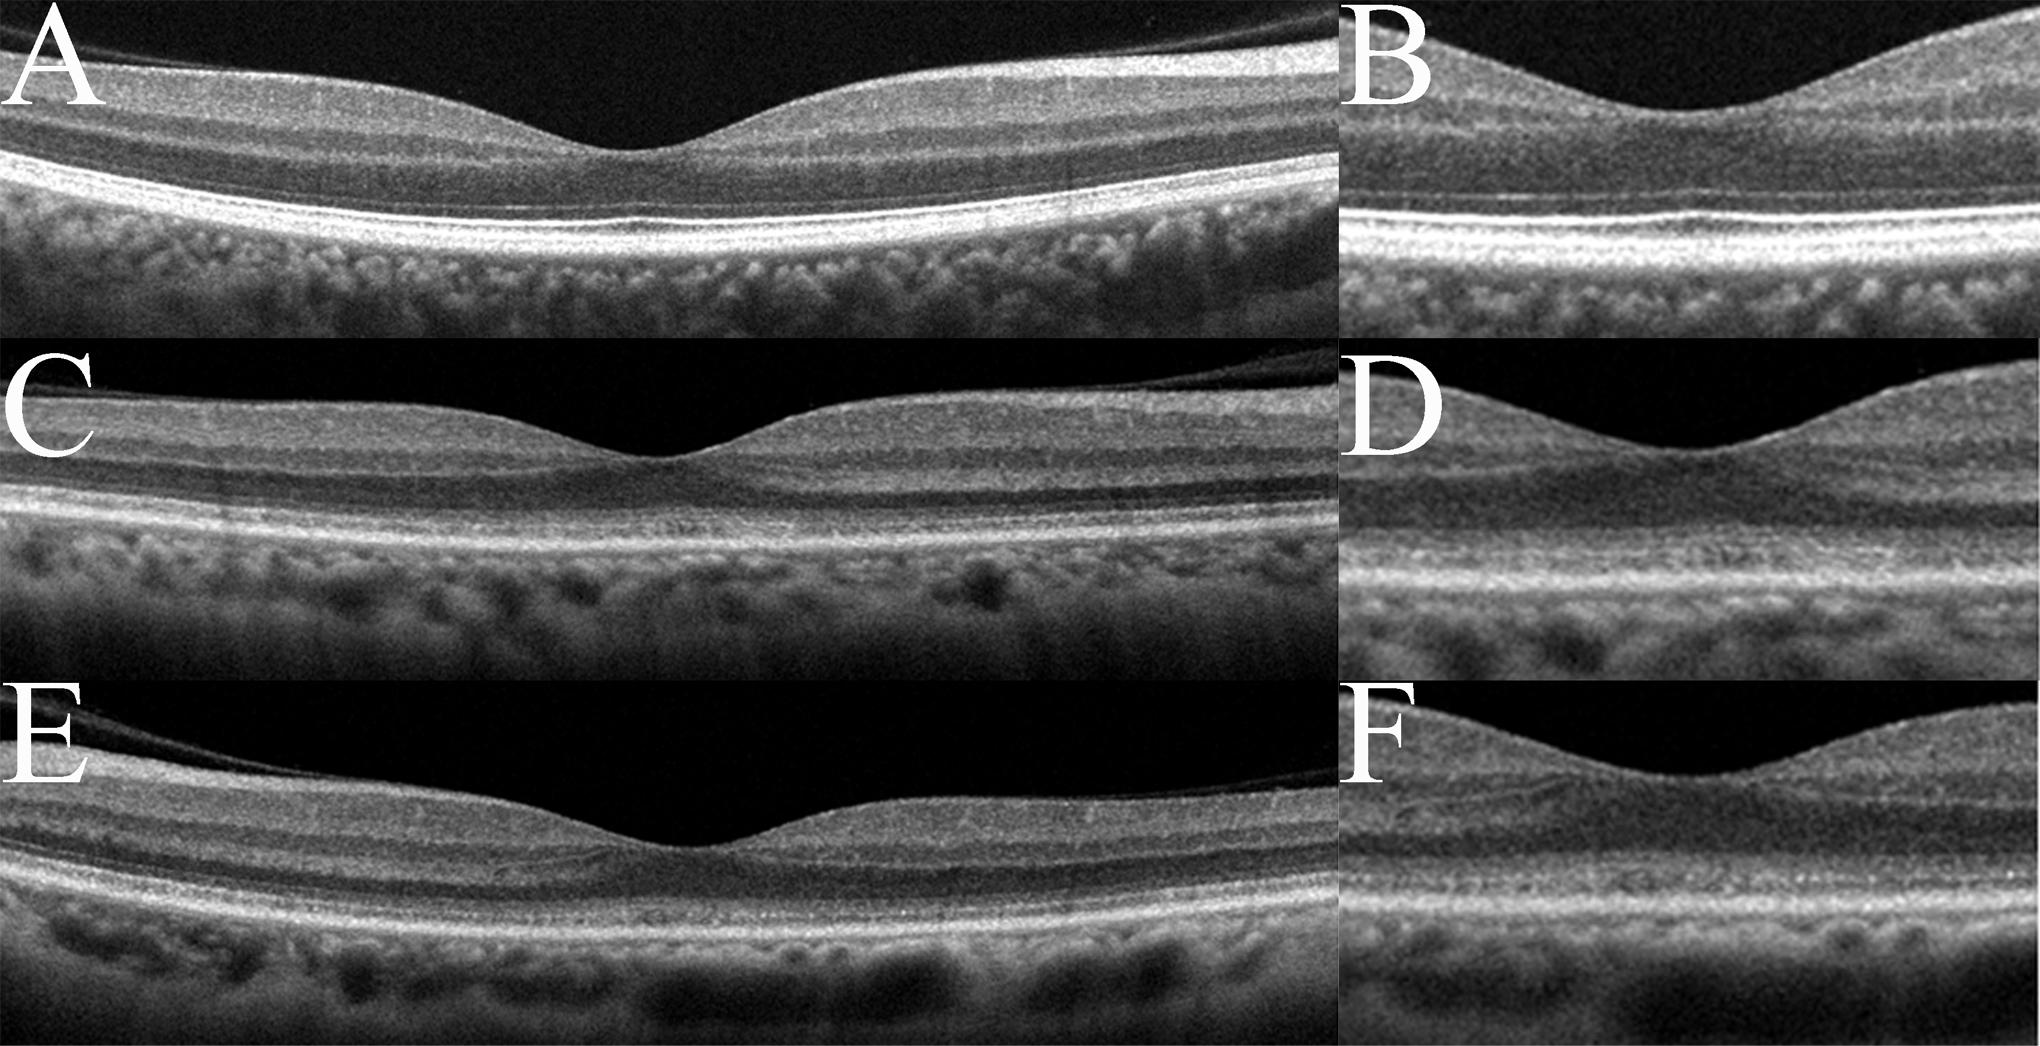
 Figure 3
of Kabuto, Mol Vis 2012; 18:1031-1039.
Figure 3
of Kabuto, Mol Vis 2012; 18:1031-1039.