Figure 2 of
Liu, Mol Vis 2011; 17:885-893.
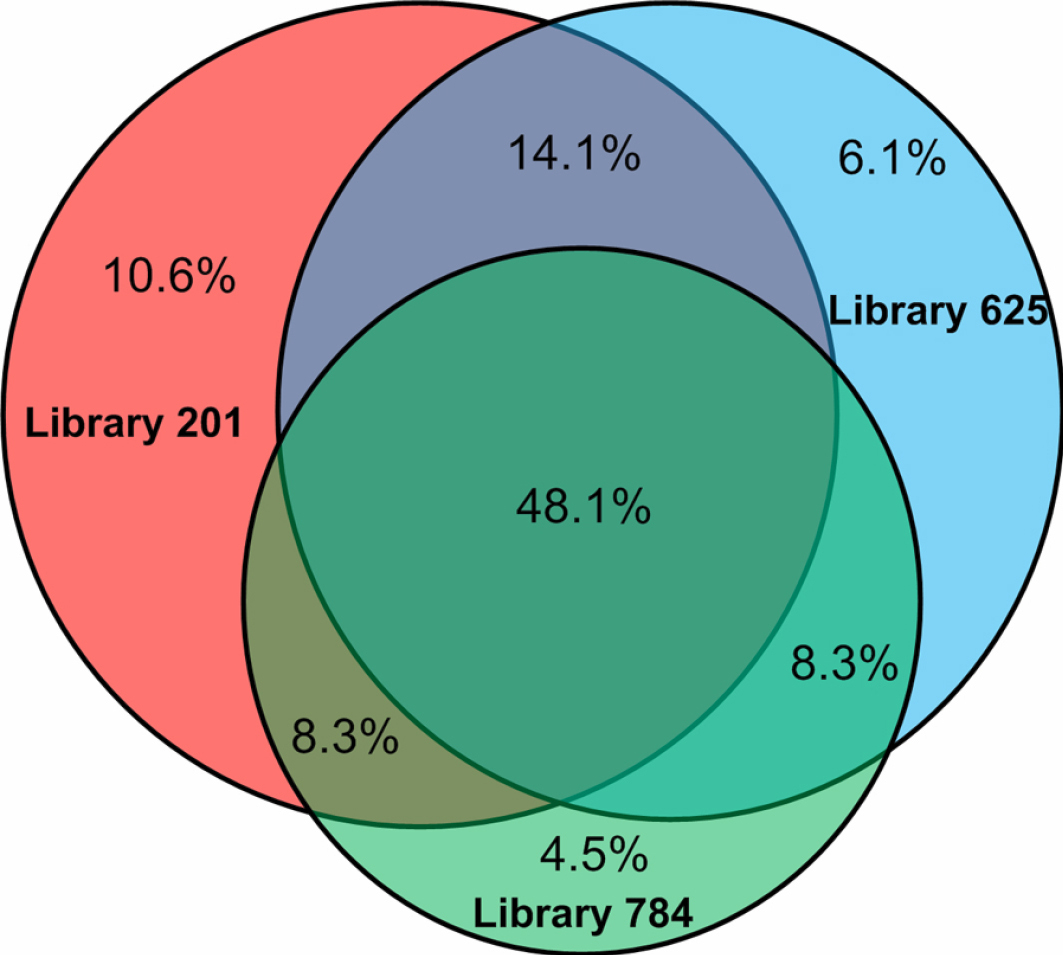
Figure 2.
Venn’s diagram to compare the genes expressed in the three libraries #201, #625, and #784. All the percentage calculation was based on the total number of unique Unigene clusters combined from all three libraries.
 Figure 2 of
Liu, Mol Vis 2011; 17:885-893.
Figure 2 of
Liu, Mol Vis 2011; 17:885-893.