Figure 4. Effect of ocular hypertension
(45 mmHg for 7 h) and RGC loss over 28 days. DTMR-labeled retinal
ganglion cell (RGC) density was examined at designated time points
after IOP elevation. A: Representative 40× images from the
central retina, showing a time-dependent loss of RGC. B:
Quantitative comparison of RGC densities between a naïve rat (Time 0)
and different days after ocular hypertension (45 mmHg for 7 h).
Symbols represent mean±SEM (n=6). #: p<0.05 versus
control using a one-way ANOVA and a Dunnett’s test. *: p<0.001
versus control using a one-way ANOVA and a Dunnett’s test.
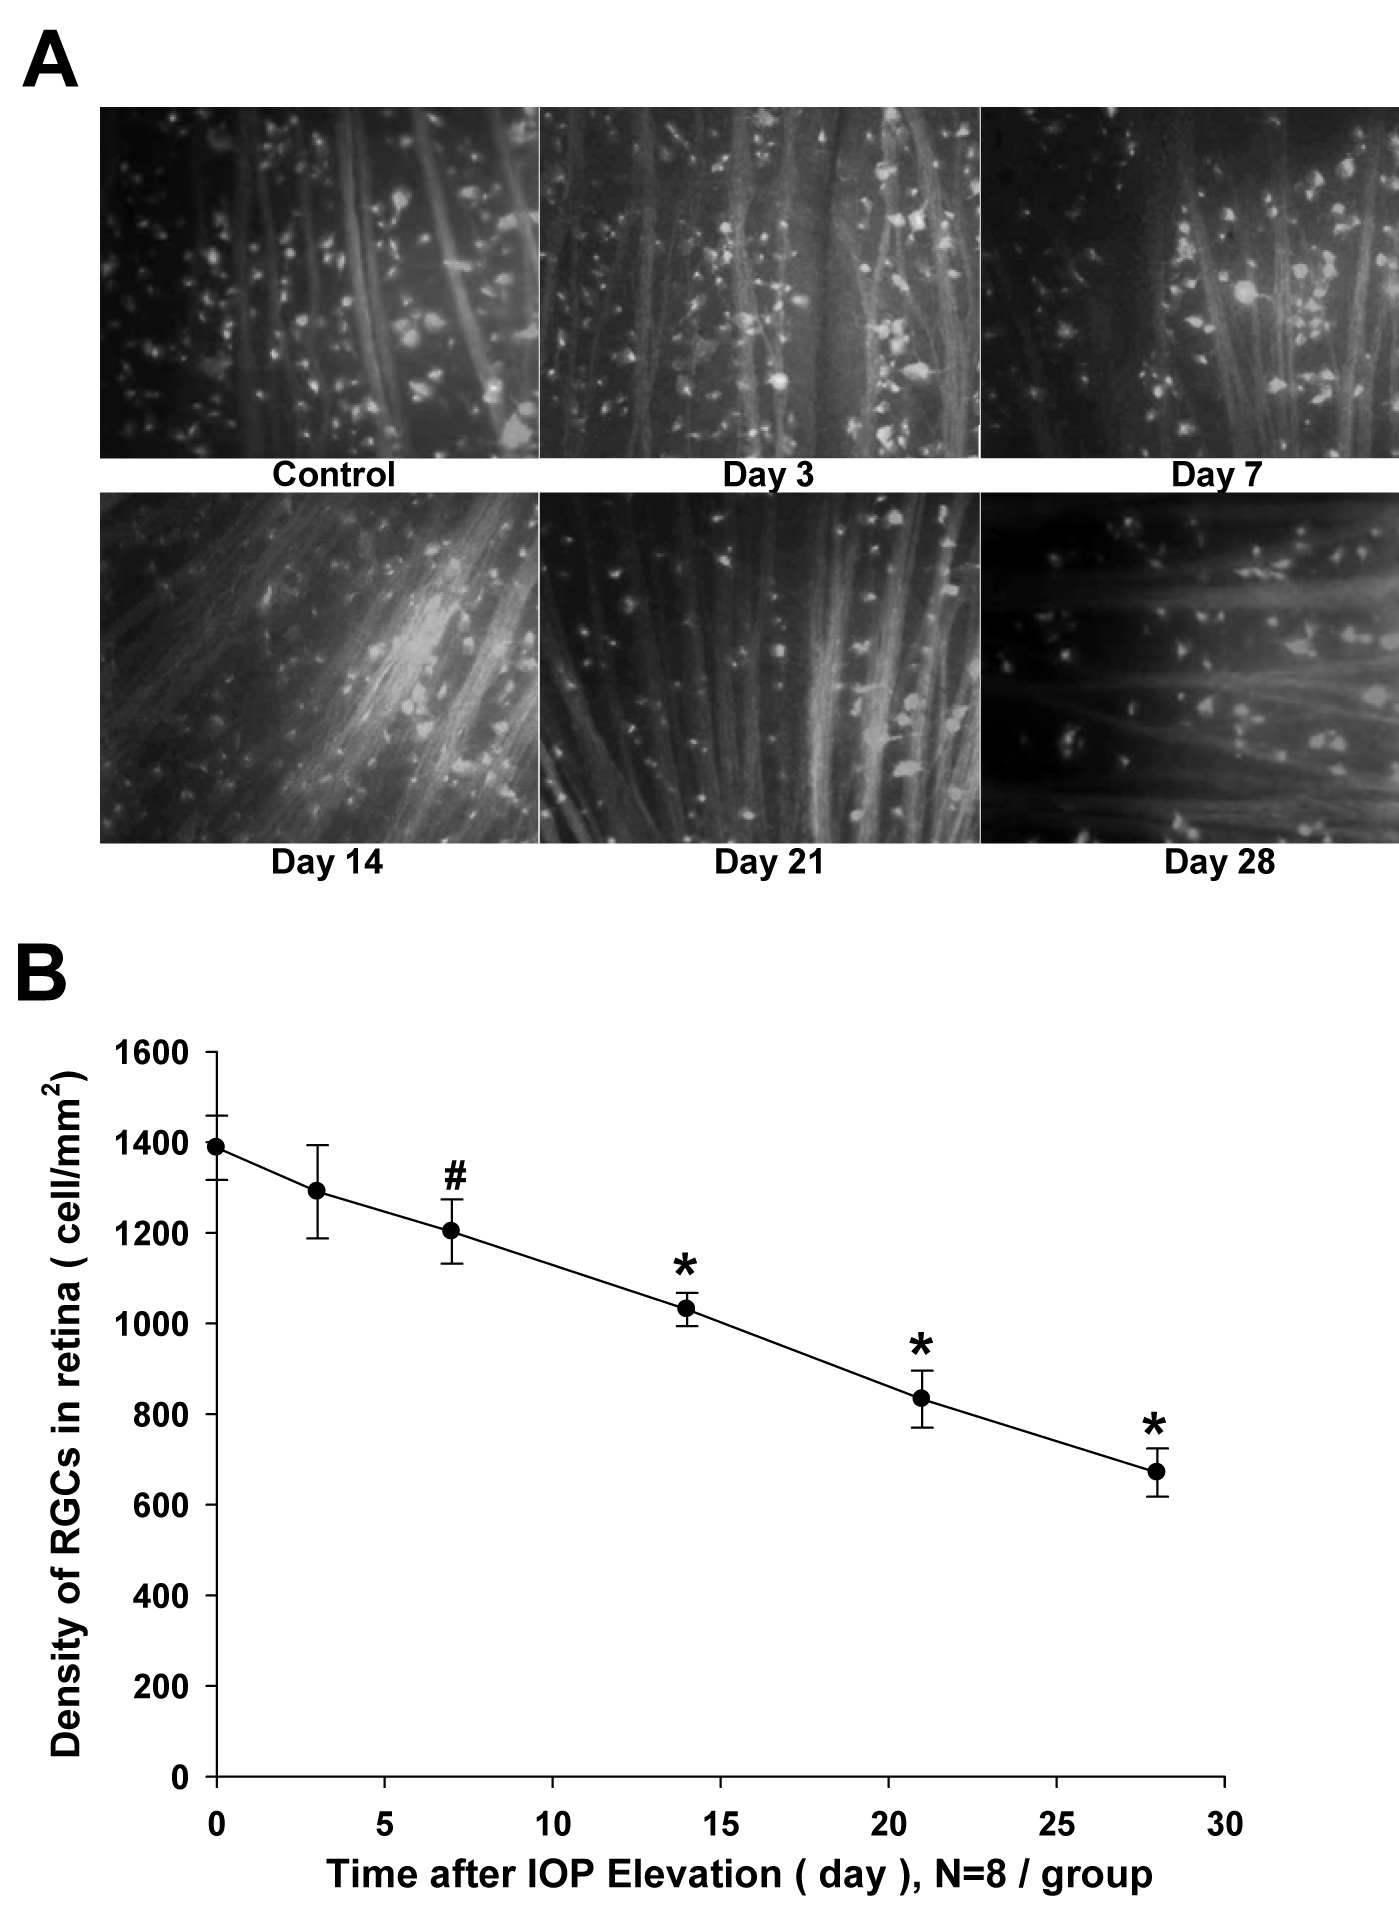
 Figure 4 of Sun, Mol Vis 2011; 17:864-875.