Figure 3. Time-dependent morphological
changes of the rat retina induced by ocular hypertension
(IOP=45 mmHg). A: Representative images of retina
cross-sections from animals with 5, 6, or 7 h of induced ocular
hypertension. The sections were stained with hematoxylin and eosin and
the thicknesses of various retinal layers and cell densities in the
ganglion cell layer (GCL) were measured. Untreated eyes served as
controls. Thicknesses of the overall retina [OLM-ILM] (B), inner
retinal layer [IPL-ILM] (C), ONL (D), OPL (E), INL
(F), and cell density in the GCL (G) were quantified and
are shown. Bars represent mean±SEM *: p<0.001 versus control using a
one-way ANOVA and a Dunnett’s test. GCL: ganglion cell layer; ILM:
inner limiting membrane; INL: inner nuclear layer; IPL: inner plexiform
layer; OLM: outer limiting membrane; ONL: outer nuclear layer; OPL:
outer plexiform layer.
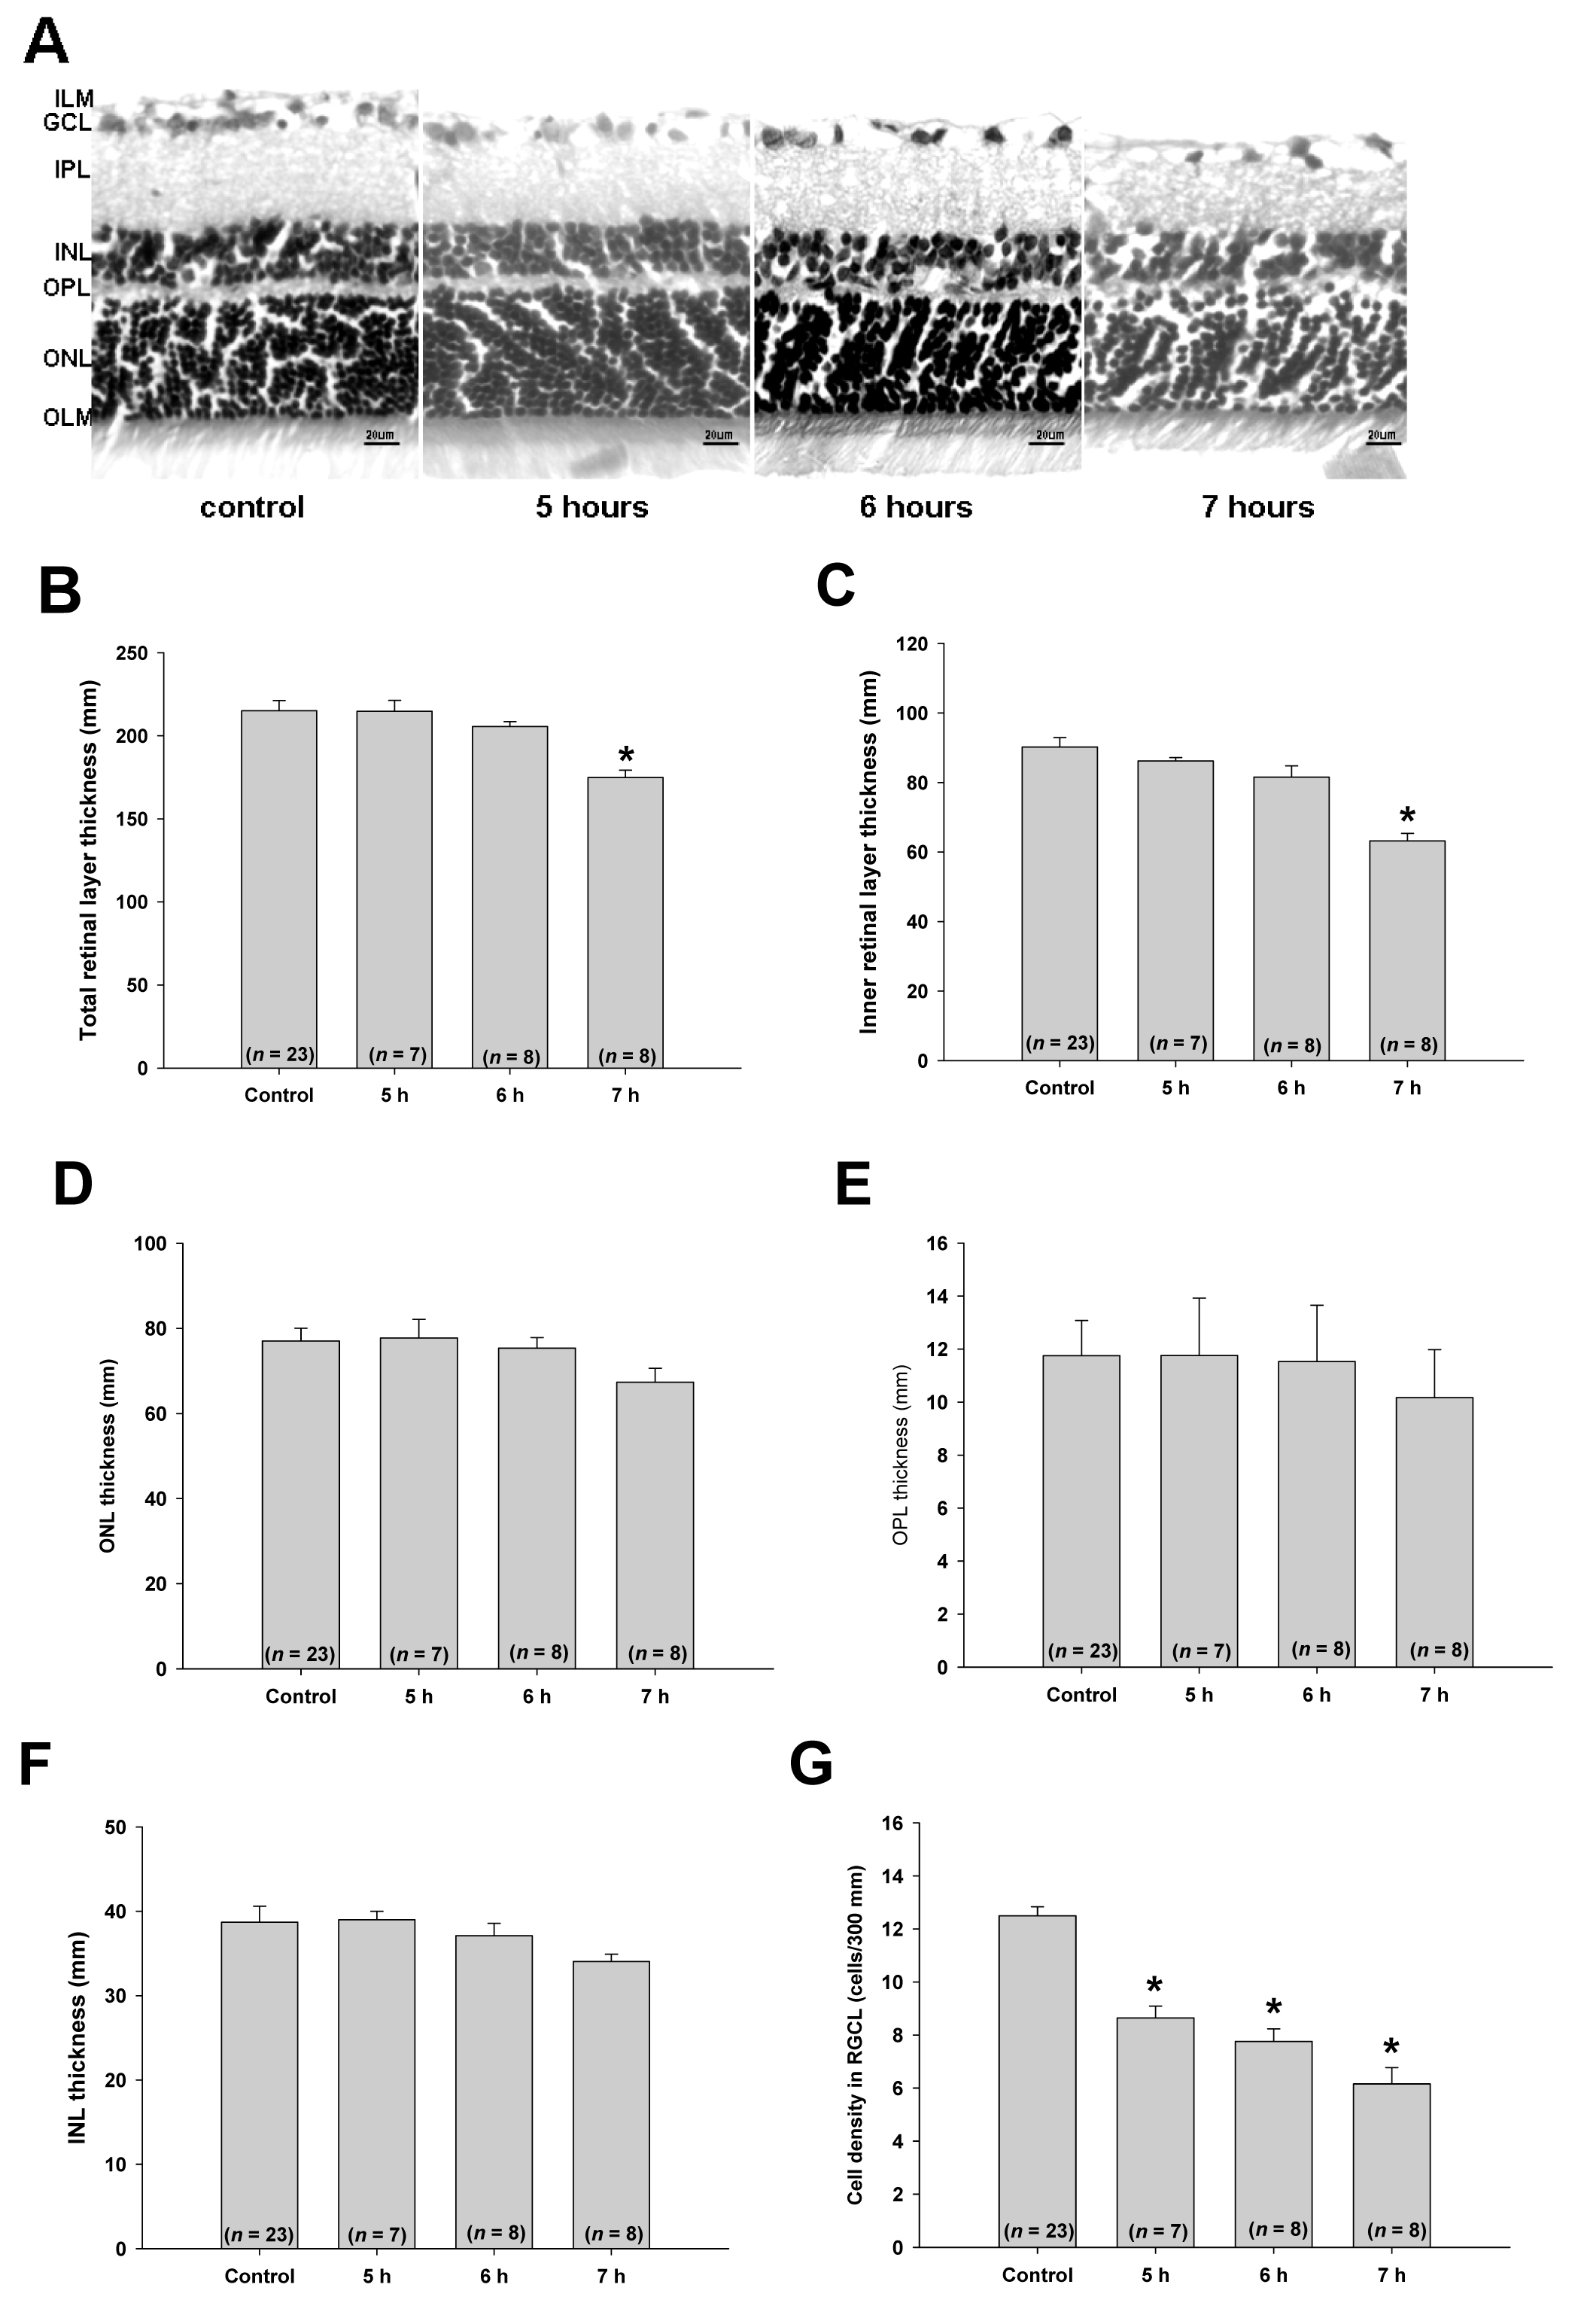
 Figure 3 of Sun, Mol Vis 2011; 17:864-875.