Figure 2. Time-dependent histological
changes of rat optic nerves (ONs) induced by ocular hypertension
(45 mmHg). Evaluation was performed four weeks after the injury. A:
Representative
images of cross-sections of ONs from rats treated with 0
(control), 1, 2, 3, 4, 5, 6, or 7 h of elevated intraocular pressure
(IOP; 45 mmHg). In the control, which was subjected to 1–4 h of
pressure, there was no identifiable axonal swelling or damage or
gliosis in the ON. When the duration of ocular hypertension was 5 h or
longer, there was apparent axonal damage (darkly stained axons) and
swelling, and gliosis (lightly stained) became obvious. B:
Higher magnification images of an ON from a control rat and one that
had elevated IOP for 5 h, showing axonal damage. C:
Semi-quantitative analysis of pressure-induced ON damage using the
Optic Nerve Damage Score (ONDS). Each symbol represents mean±SEM (n=8).
*p<0.001 versus the control group using a one-way ANOVA and a
Dunnett’s test.
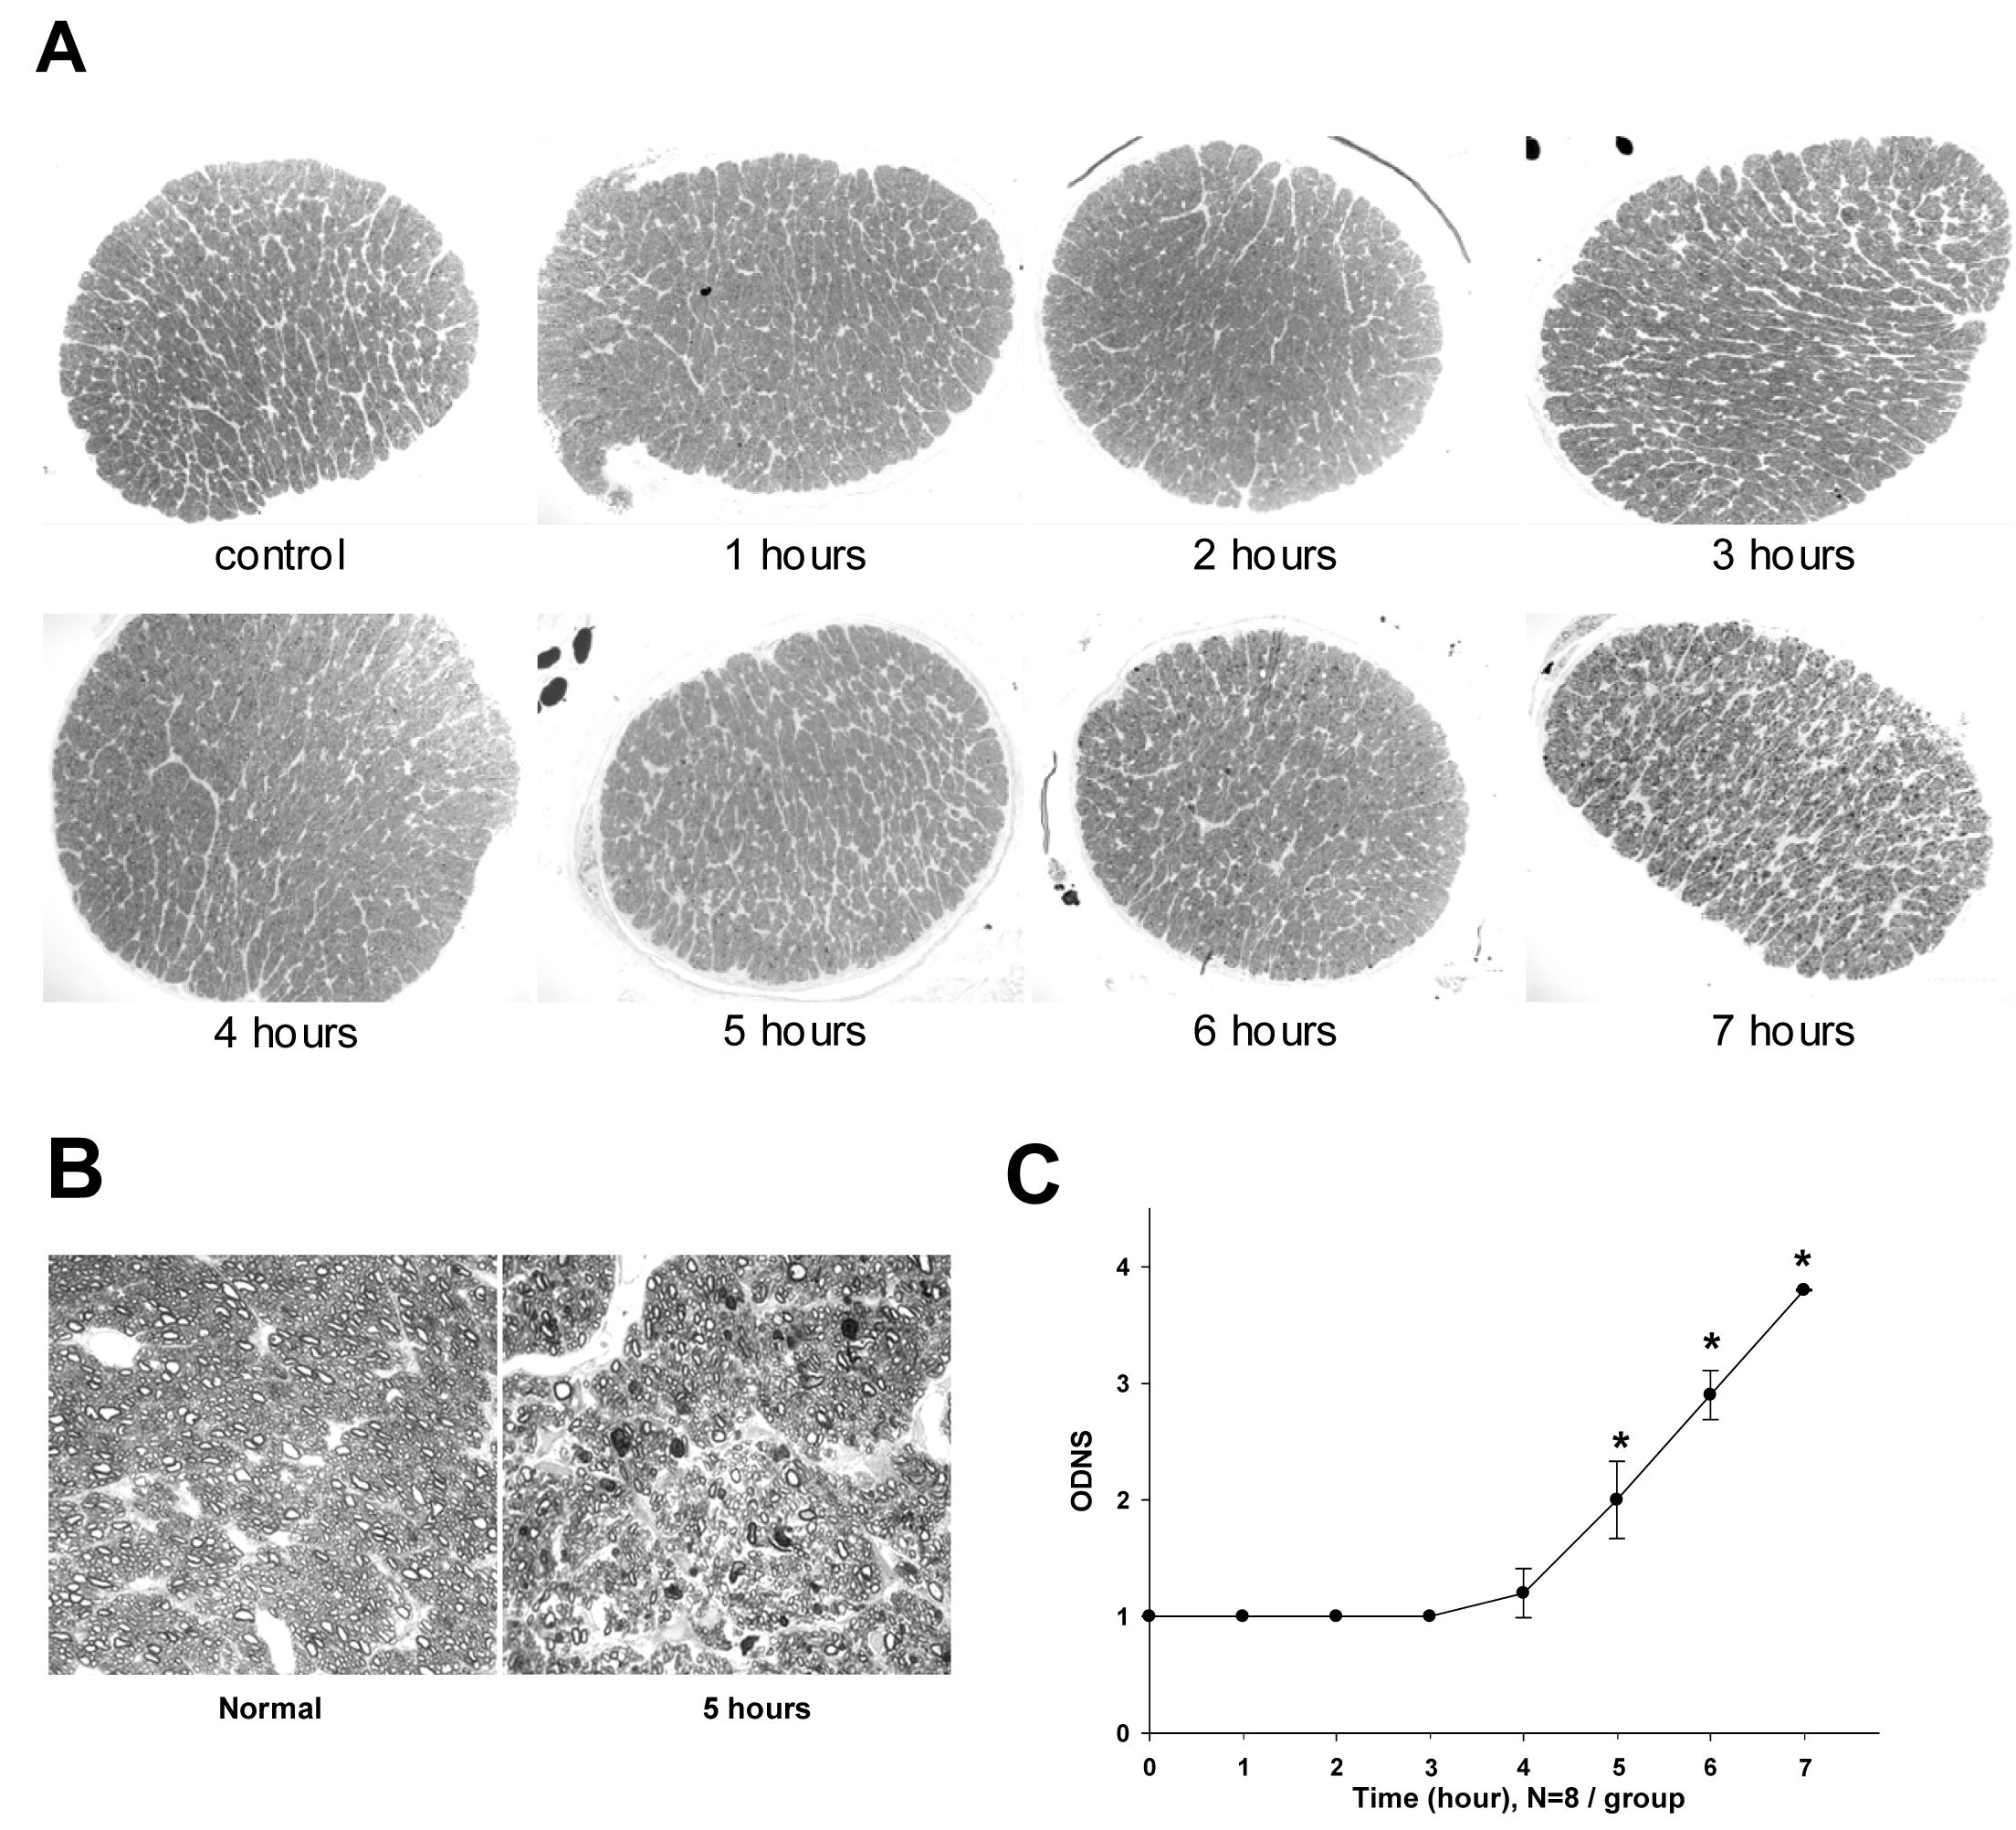
 Figure 2 of Sun, Mol Vis 2011; 17:864-875.