Figure 1. Intraocular pressure (IOP)
elevation using the suture-pulley technique. A: Relationship of
rat IOP and weights attached to the ends of the suture. The IOP was
measured for 60 min after the indicated weights were attached. Each
symbol represents mean±SEM (n=6). *: p<0.001 versus baseline using a
one-way ANOVA and a Dunnett’s test. B: Effect of using 15 g
weight on rat IOP. The weight was applied starting at Time 0 and was
maintained for 7 h for anesthetized rats. Each symbol represents
mean±SEM (n=31 from Time 0 to 360 min, n=17 from 360 min to 420 min).
*: p<0.001 versus baseline using a one-way ANOVA and a Dunnett’s
test.
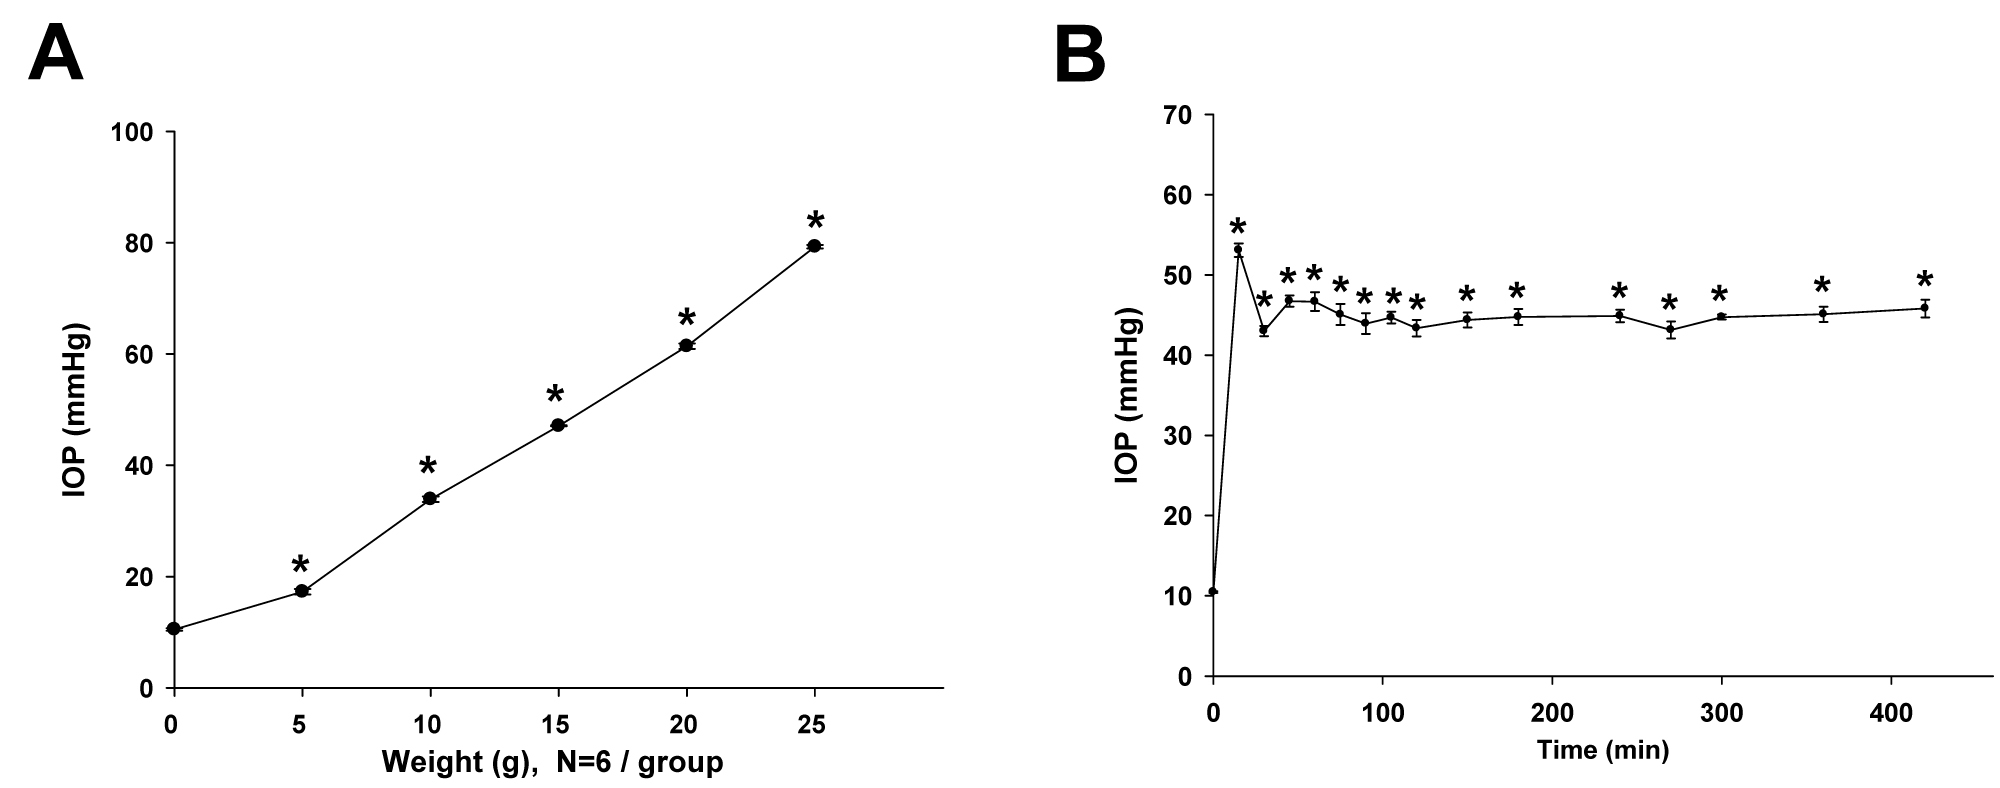
 Figure 1 of Sun, Mol Vis 2011; 17:864-875.