Figure 2. Comparison and scoring of
corneal smoothness, opacity, and lissamine green staining among UVB
(UVB exposure without dietary zerumbone), UVB/ZER (UVB exposure with
dietary zerumbone at 1, 10, and 100 mg/kg of bodyweight, respectively),
and blank control (no UVB exposure and no dietary zerumbone) groups.
All scale bars: 1.25 mm.
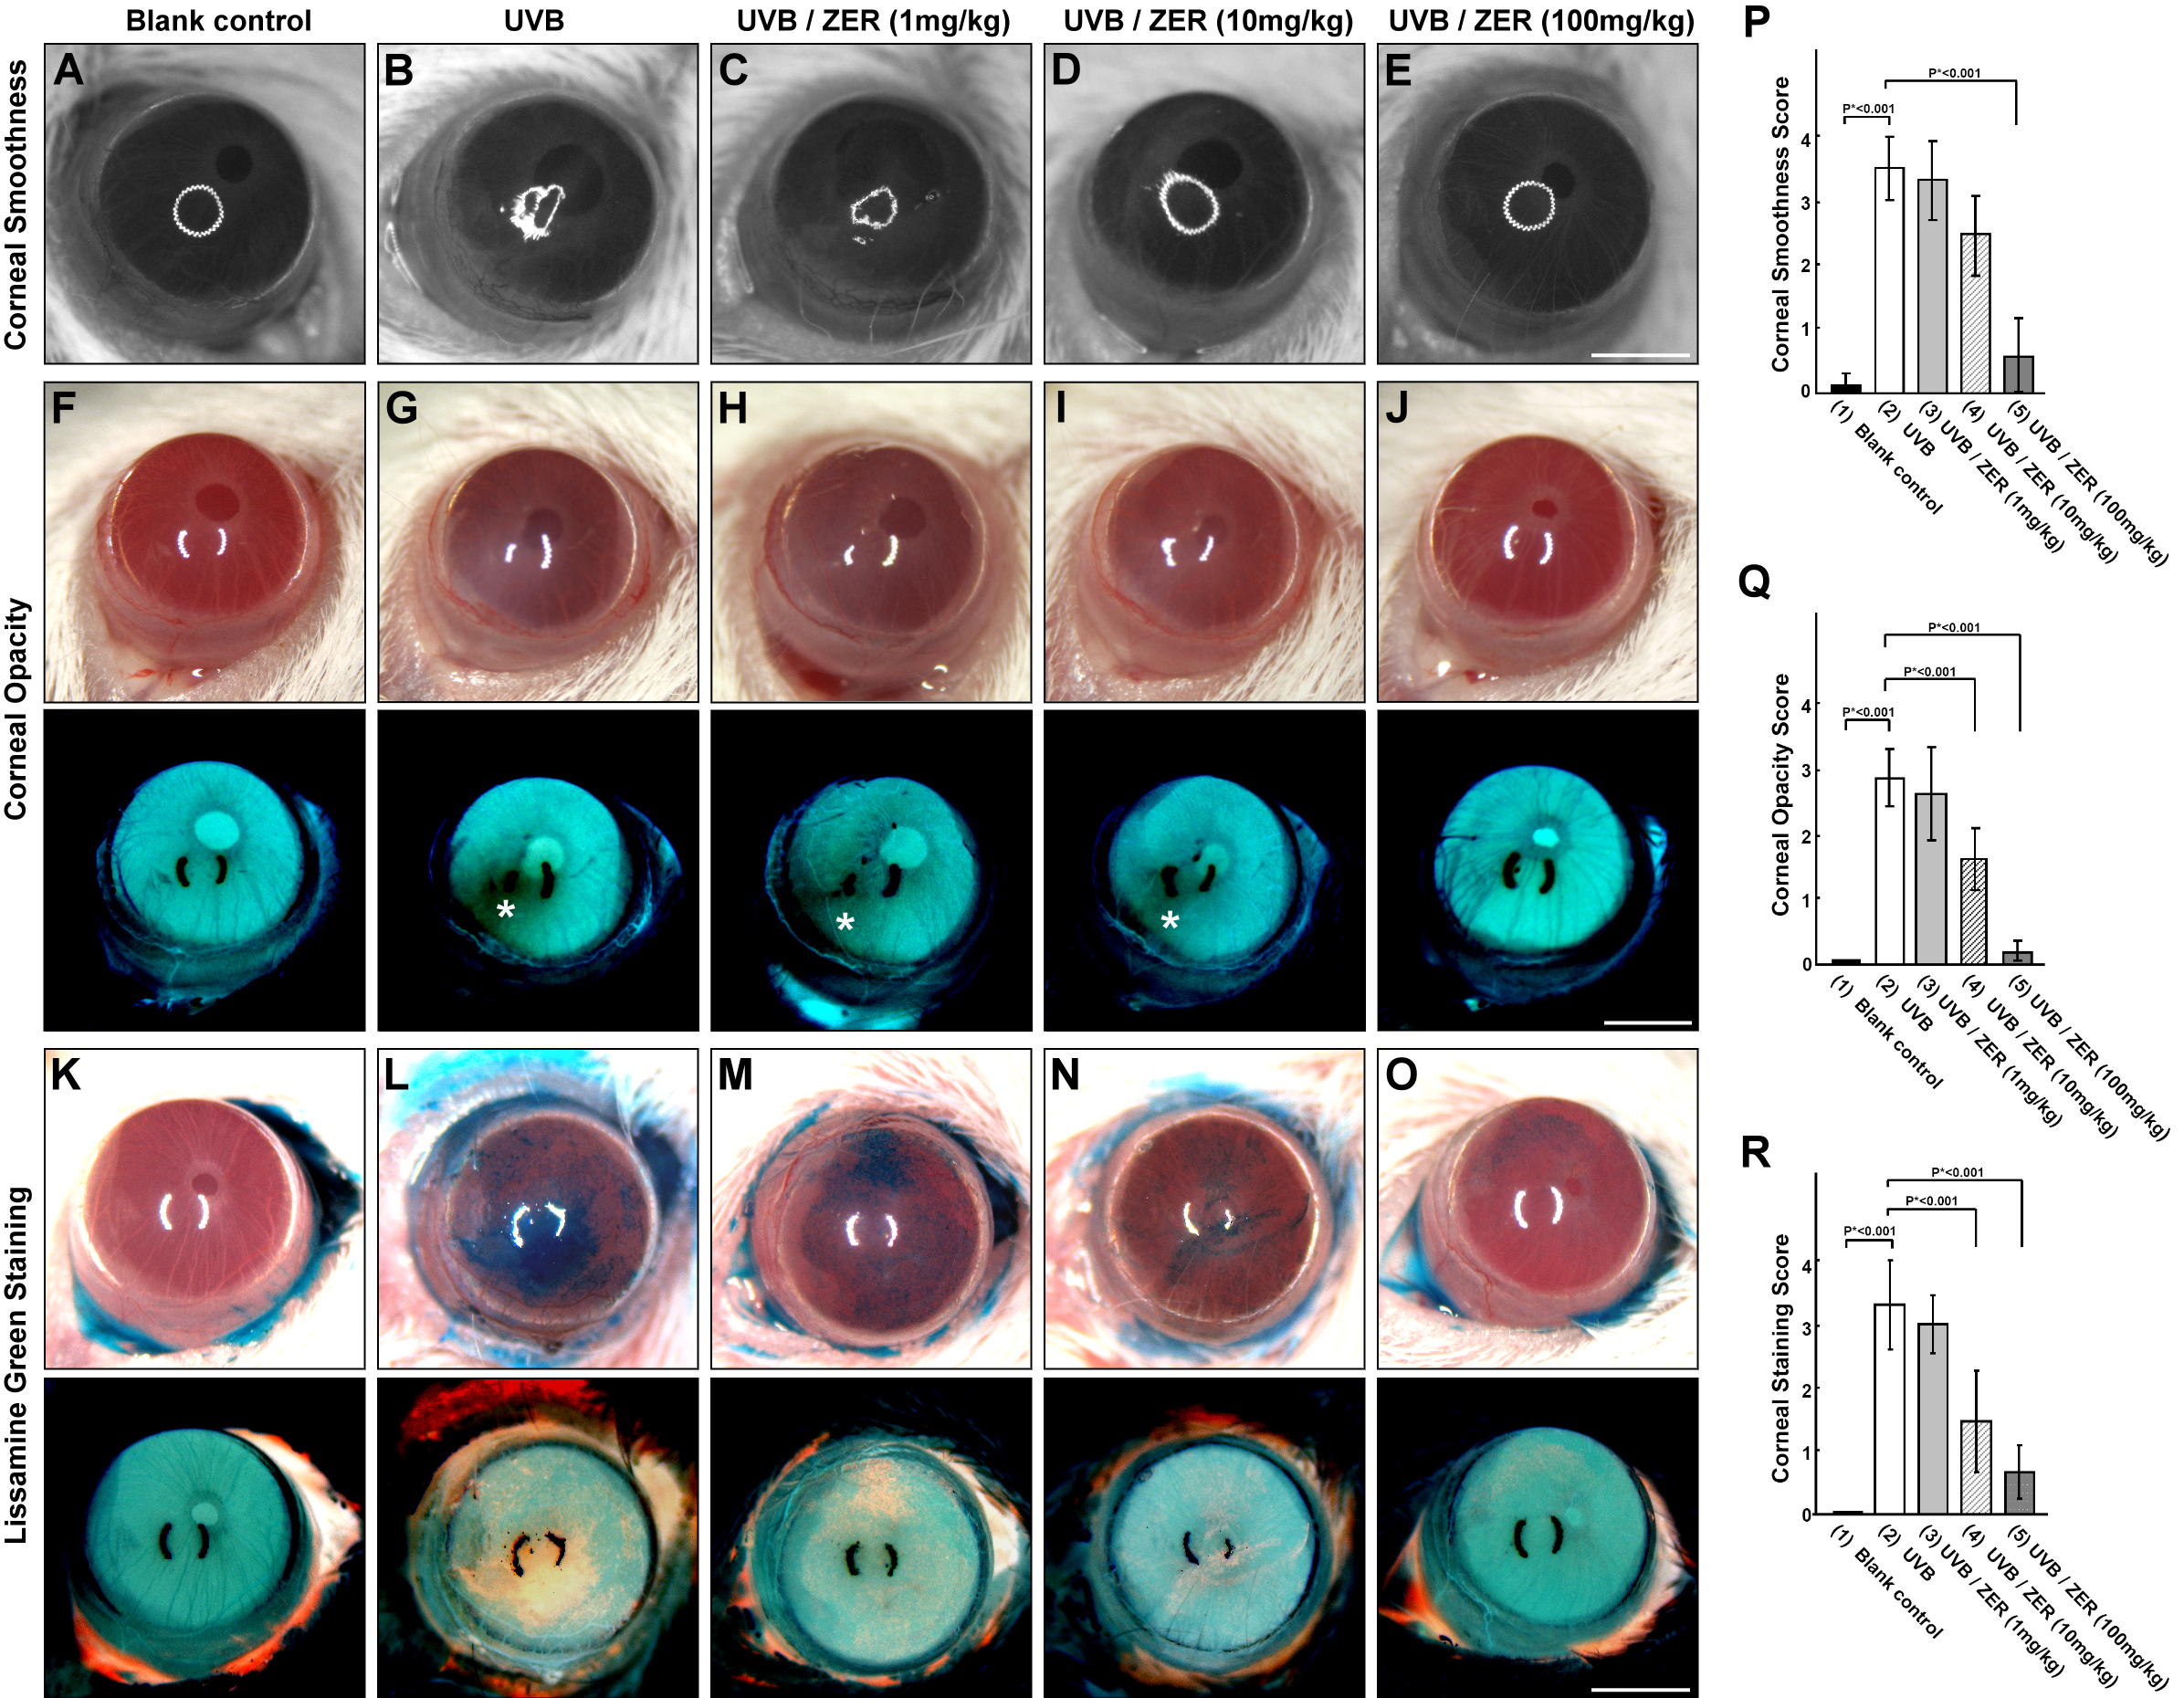
 Figure 2 of Chen, Mol Vis 2011; 17:854-863.