Figure 5. Structure homology modeling and comparison of mutant protein and native human CRYGD (1hk0). A: Native human CRYGD and B: Mutant protein. Red, yellow, and blue indicate α-helix, β-sheet, and β-turn, respectively, white indicates other residues.
R, P and Q represent Arg36, Pro36, and Gln12, respectively.
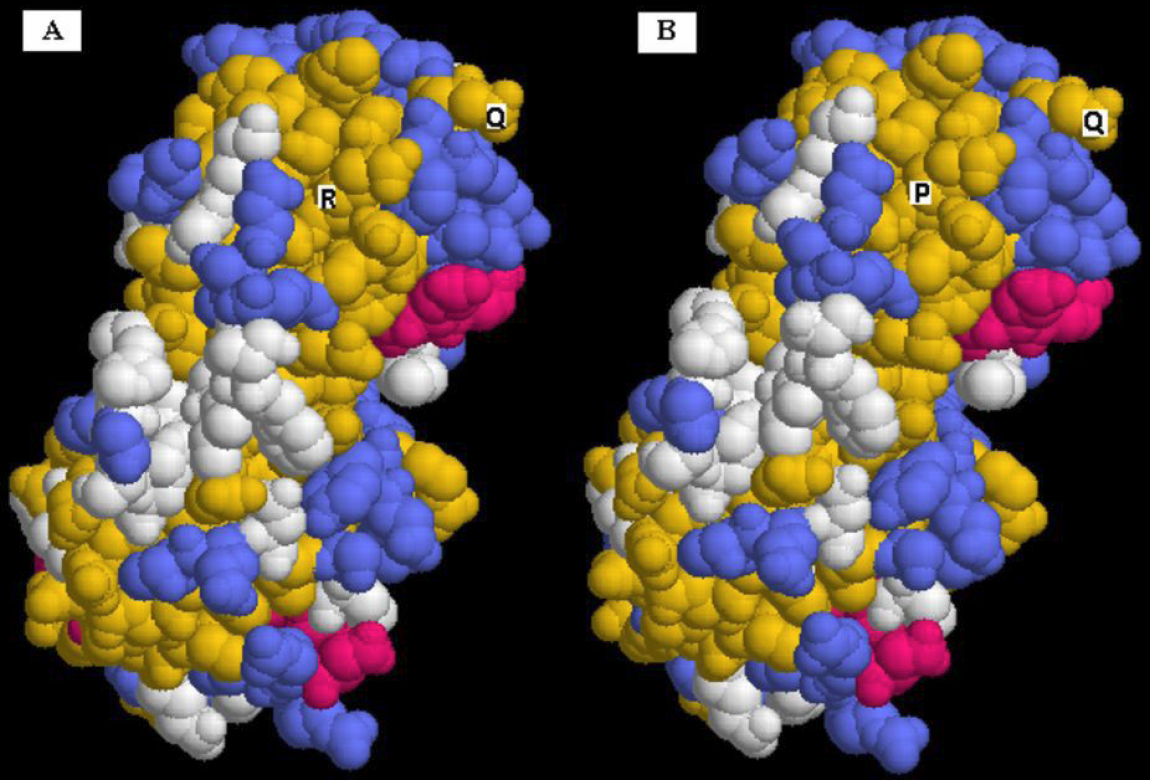
 Figure 5 of
Wang, Mol Vis 2011; 17:804-809.
Figure 5 of
Wang, Mol Vis 2011; 17:804-809.