Figure 2. Proteins with significantly
higher spectral counts at two time points following laser treatment.
Counts are represented as mean number of normalized scans±SEM for
control (n=6) and treated samples (n=6) at 4 h (4 h), 1 day (1 day),
and 3 days (3 days) following either mock or laser treatment. *p≤0.05,
**p≤0.01, ***p≤0.001, for significant differences in treated samples
compared with corresponding controls at each time point.
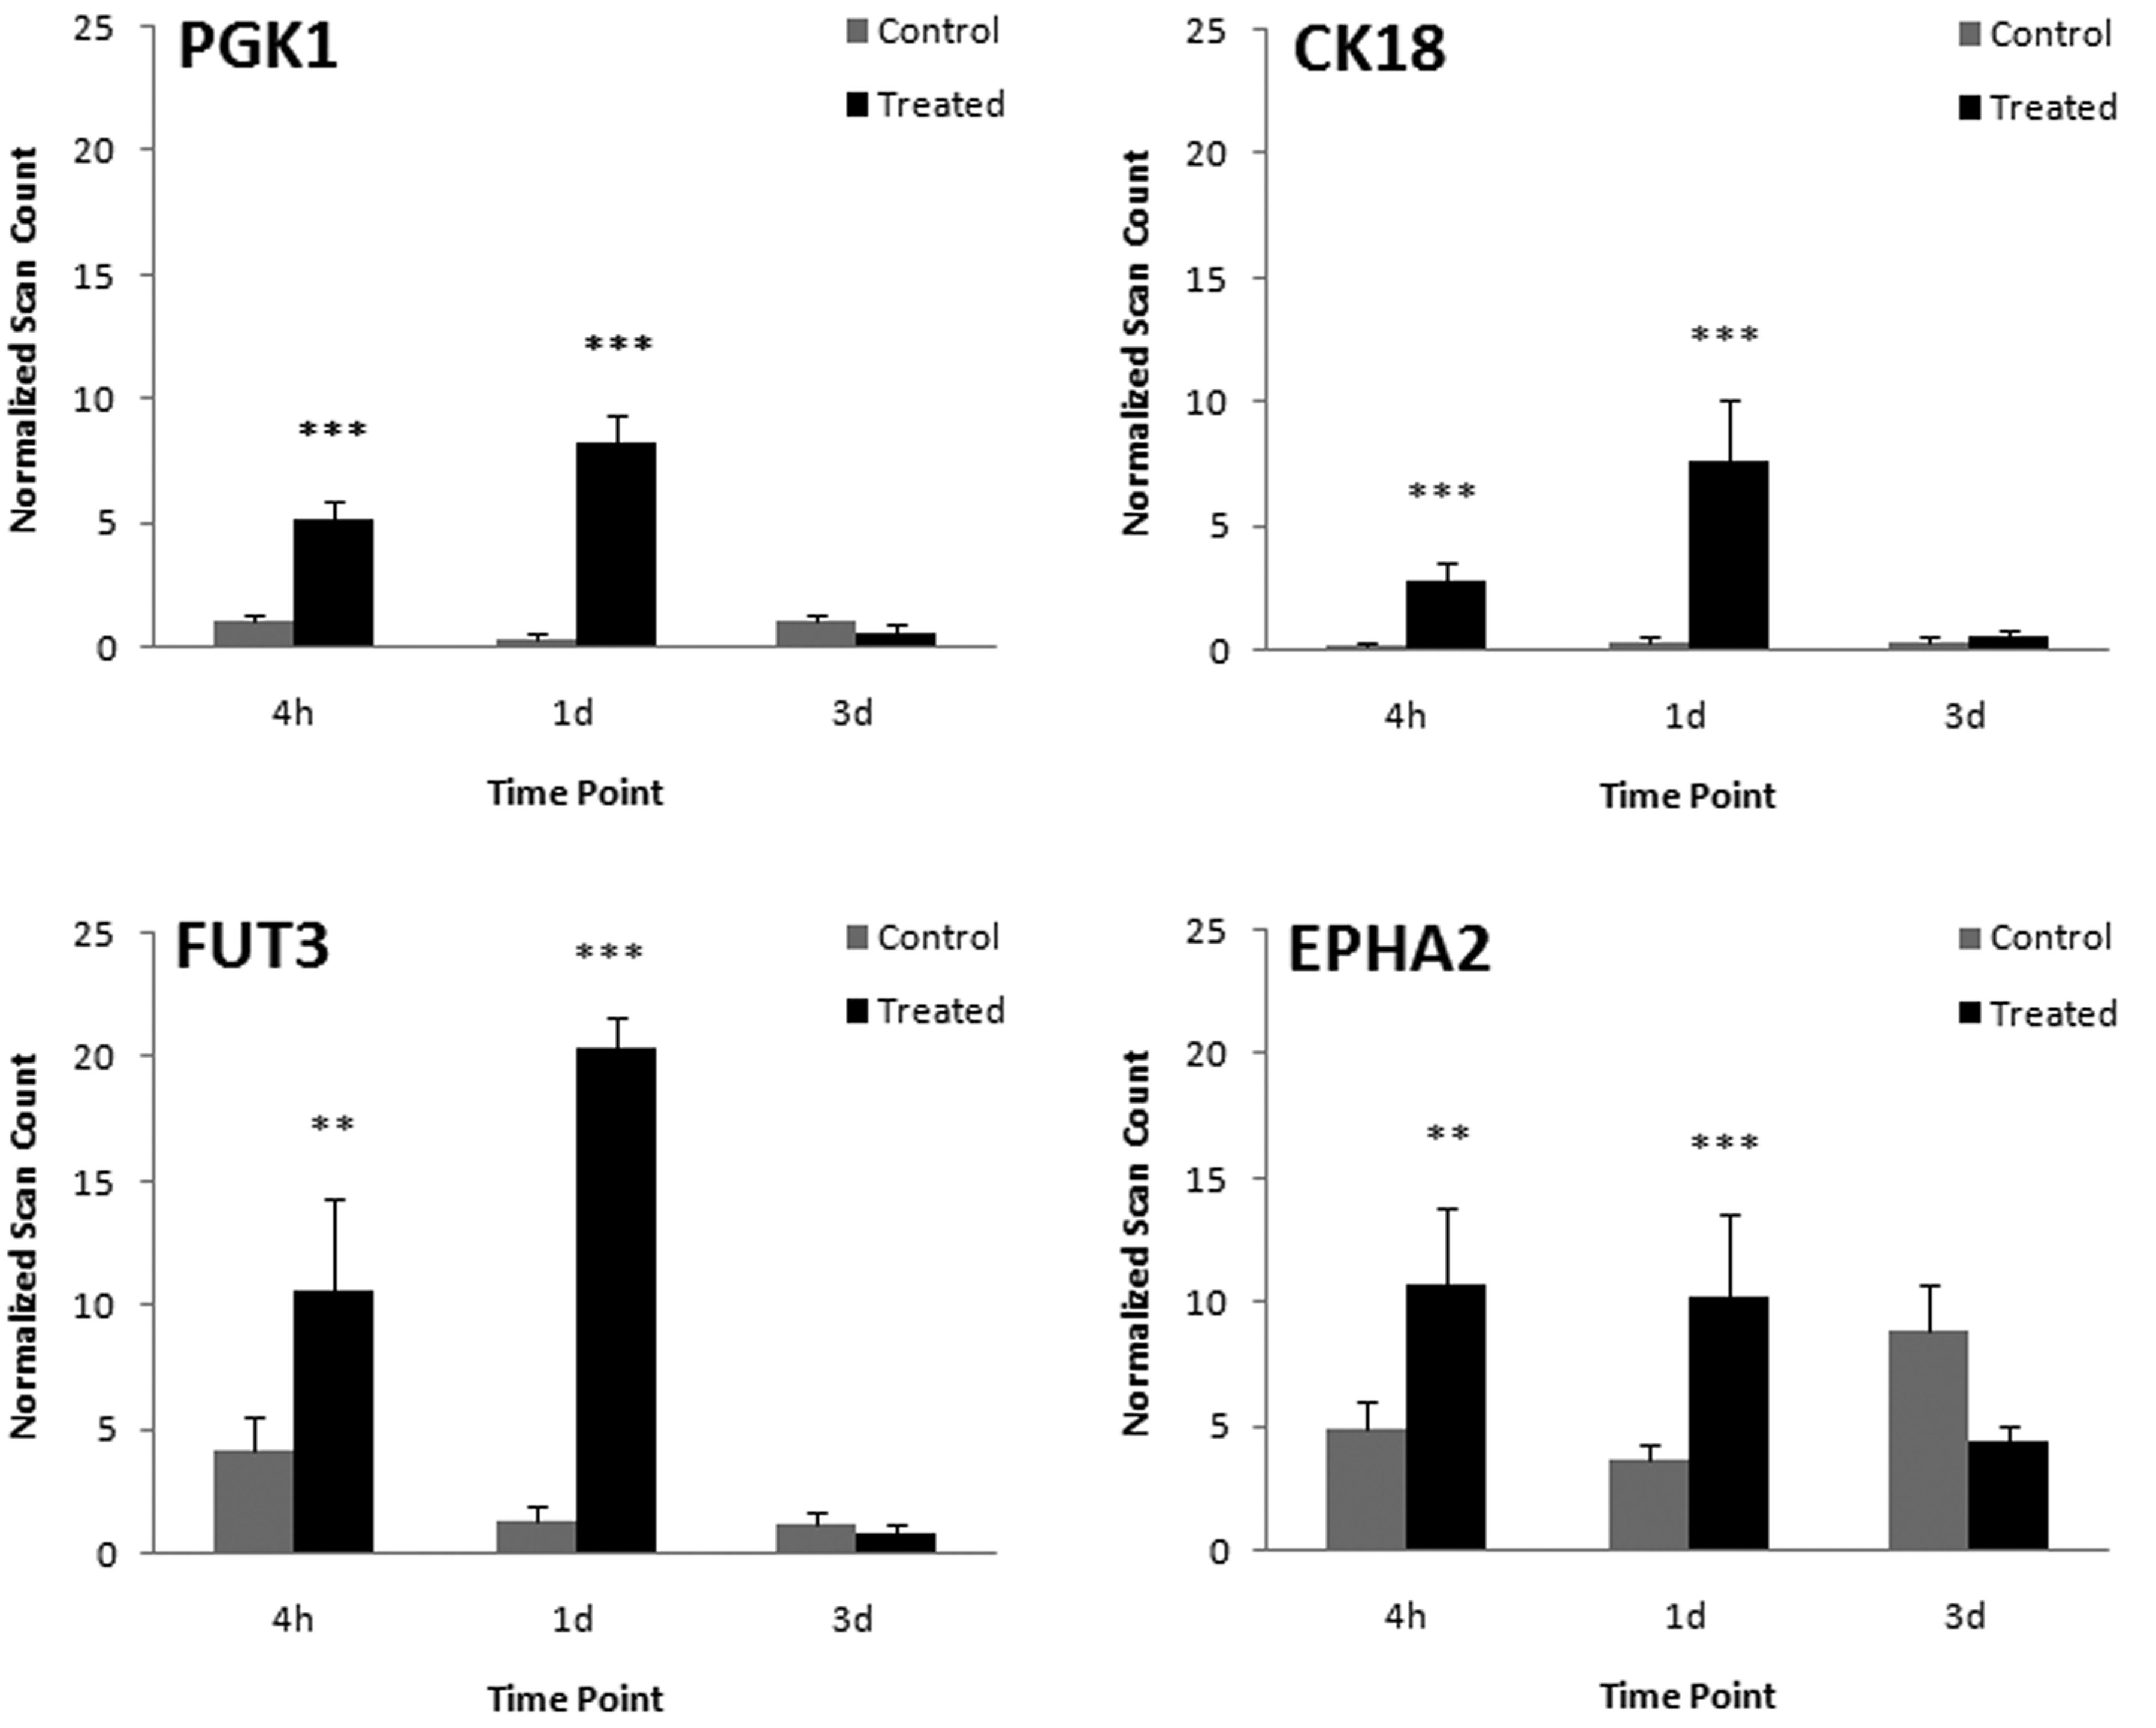
 Figure 2 of Dunmire, Mol Vis 2011; 17:779-791.