Figure 2. Real-time PCR analysis for
transcripts of αA-crystallin and βB1-crystallin during the lens
development. Stages are according to the normal table of Nieuwkoop
& Faber. The red curve illustrates the relative expression of
transcripts of αA-crystallin. From the beginning of expression at stage
26 to stage 38, it displayed an increasing trend. After stage 38, the
expression began to decrease. Finally, the expression quantity
maintained at a relative stable level. The same went for
βB1-crystallin, which is shown by the black curve.
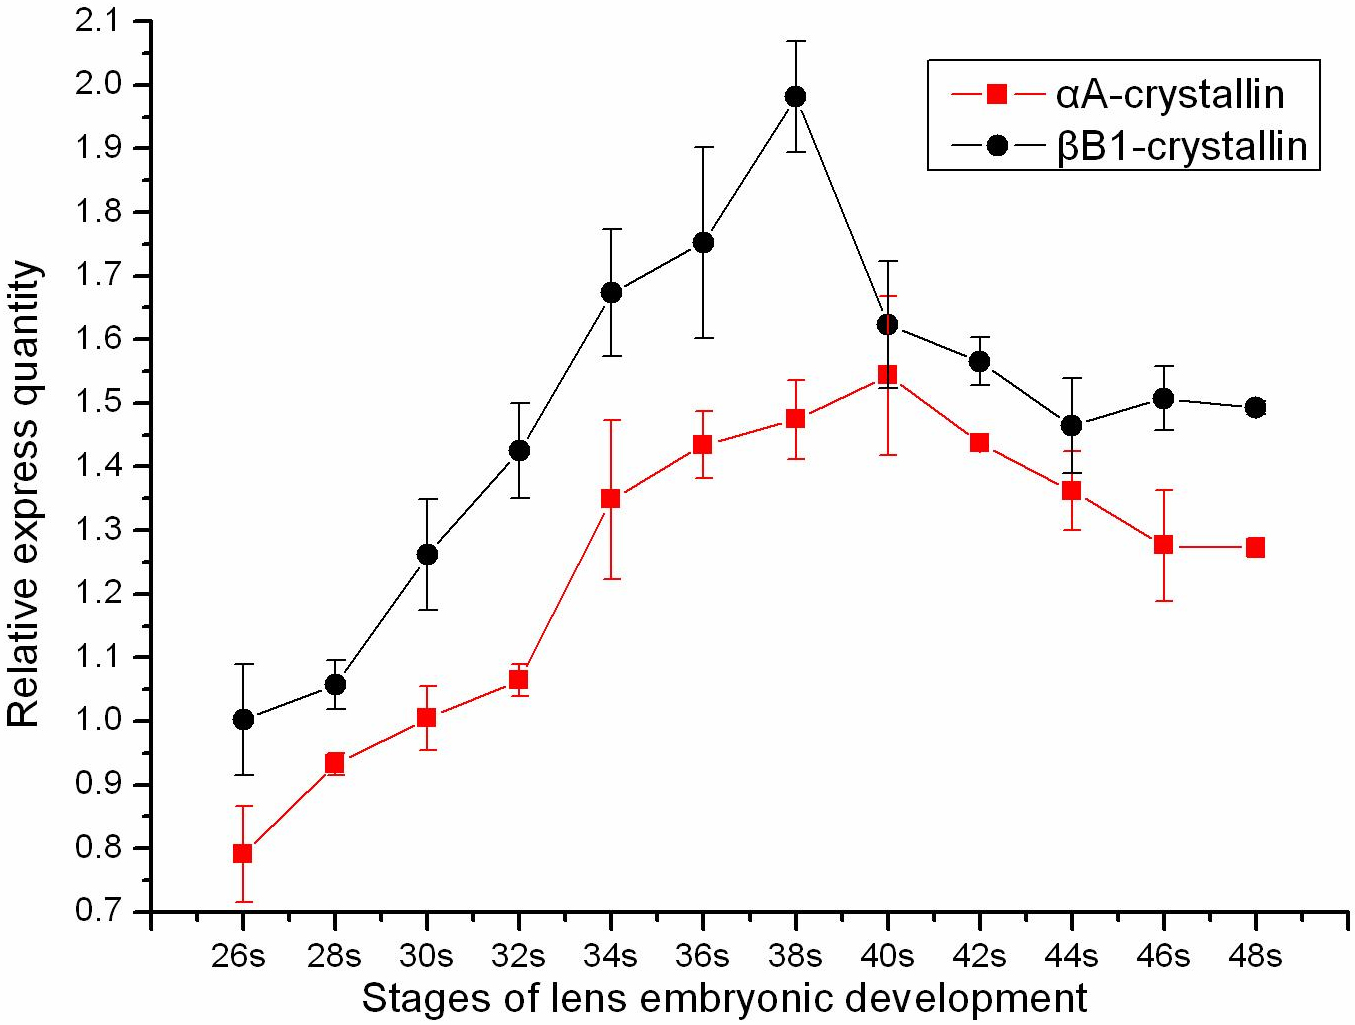
 Figure 2 of Zhao, Mol Vis 2011; 17:768-778.