Figure 5. Tight junction-associated protein occludin. Immunofluorescence analysis of occludin expressions using en-face confocal microscopy
after treatment with PBS (A), 0.01% BAC (B), NAA-BAC(-) (C) CRO-BAC(-) (D), KETO-BAC(-) (E), KETO-BAC(+) (F), OPA-BAC(+) (G), EPI-BAC(+) (H), LEVO-BAC(+) (I). Bar=100 µm.
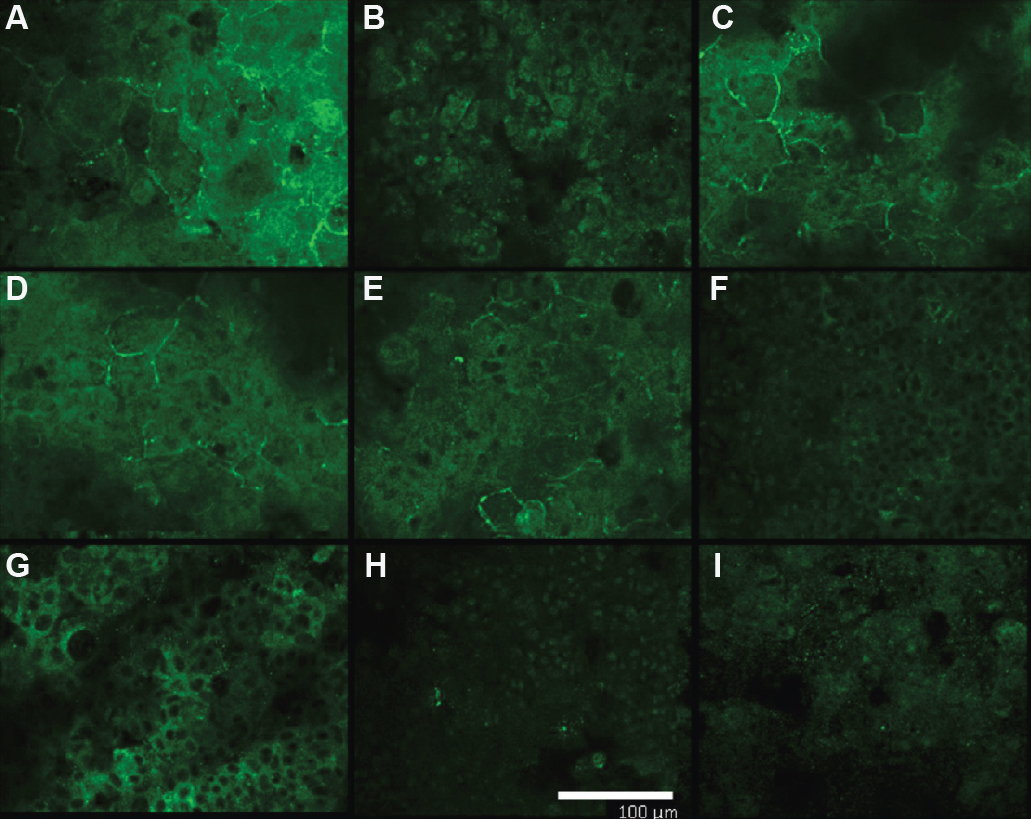
 Figure 5 of
Pauly, Mol Vis 2011; 17:745-755.
Figure 5 of
Pauly, Mol Vis 2011; 17:745-755.