Figure 3. Inflammation analysis. Immunolocalization of CD54 (ICAM-1) positive cells (green) on 3D-HCE samples after 24 h of incubation
with PBS (A), 0.01% BAC (B), KETO-BAC(-) (C), KETO-BAC(+) (D), NAA-BAC(-) (E), OPA-BAC(+) (F), CRO-BAC(-) (G), EPI-BAC(+) (H), LEVO-BAC(+) (I). Nuclei were stained with propidium iodide (PI, red). PBS (A), KETO-BAC(-) (C), NAA-BAC(-) (E) and CRO-BAC(-) (G) showed a weak expression of CD54. A significant increase of CD54 expression was observed after the treatments with 0.01%
BAC (B) and LEVO-BAC(+) (I), showing a green staining in all the epithelial layers. LEVO-BAC(+) (I) showed deeper modifications with a higher loss of continuity between cells and a higher level of vacuolization observed
in the basal epithelial layers. KETO-BAC(+) (D), OPA-BAC(+) (F) and EPI-BAC(+) (H) showed an intermediate CD54 expression that was localized in all epithelial layers. Quantification of CD54-positive cells
(J) showed a higher CD54 expression with BAC at 0.01% or the four BAC-containing formulations KETO-BAC(+), OPA-BAC(+), EPI-BAC(+)
and LEVO-BAC(+) than with the unpreserved formulations NAA-BAC(-), CRO-BAC(-), KETO-BAC(-) at 24 h. *Statistically significant
compared to PBS with p<0.001. **Statistically significant compared to 0.01% BAC with p<0.001. Results are expressed as cell
number per mm of epithelial length (mm.E.L.): Mean±SD.
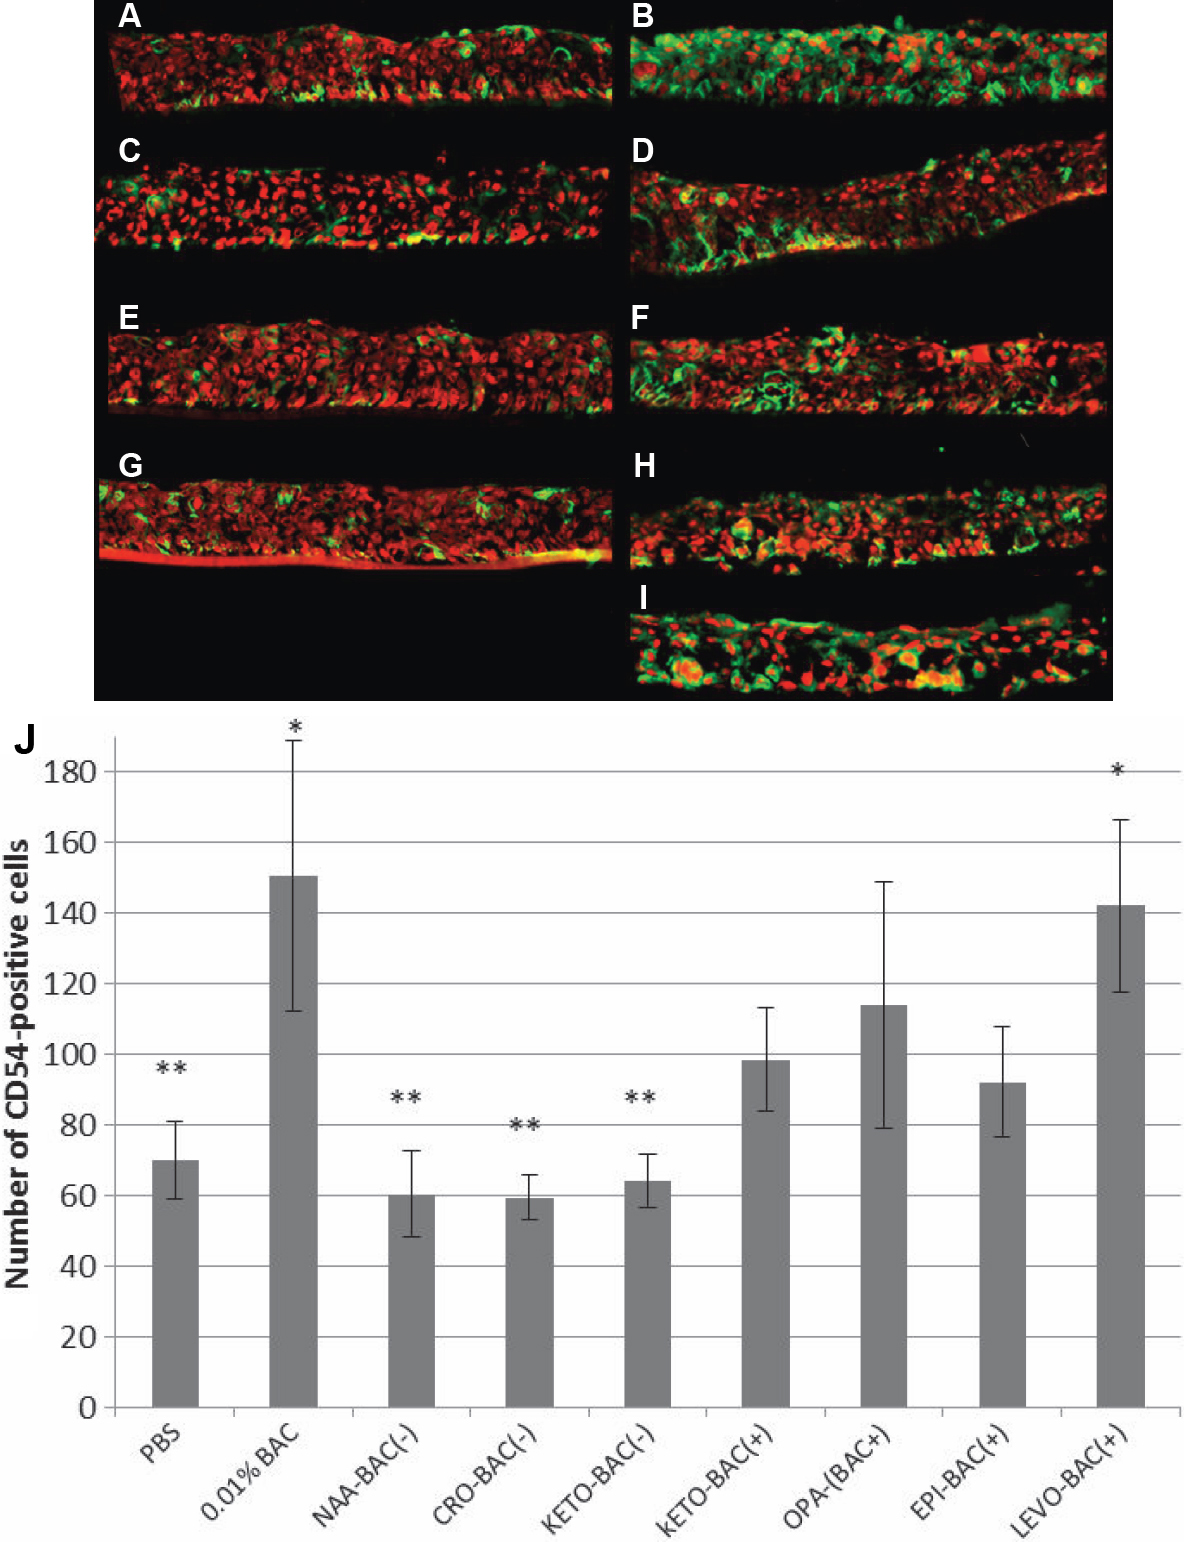
 Figure 3 of
Pauly, Mol Vis 2011; 17:745-755.
Figure 3 of
Pauly, Mol Vis 2011; 17:745-755.