Figure 2. Apoptosis analysis (TUNEL). Localization of TUNEL positive cells (green) on 3D-HCE samples after 24 h of incubation with PBS
(A), 0.01% BAC (B), KETO-BAC(-) (C), KETO-BAC(+) (D), NAA-BAC(-) (E), OPA-BAC(+) (F), CRO-BAC(-) (G), EPI-BAC(+) (H), LEVO-BAC(+) (I). Nuclei were stained with DAPI (blue). No or very rare apoptotic cells were observed after PBS (A), KETO-BAC(-) (C), KETO-BAC(+) (D) and NAA-BAC(-) (E) treatments. KETO-BAC(+) (D) and OPA-BAC(+) (F) induced moderate expression of apoptosis, and 0.01% BAC (B), EPI-BAC(+) (H) and LEVO-BAC(+) (I) induced a greater number of TUNEL-positive cells principally in the apical cell layers, and also in the middle epithelial
layers with EPI-BAC(+) (H) and LEVO-BAC(+) (I). Deeper modifications were observed with 0.015% BAC-containing LEVO-BAC(+) (I) compared to 0.01% BAC (B), with a greater number of TUNEL-positive cells in the middle epithelial layers and a higher level of vacuolization in the
basal epithelial layers observed with LEVO-BAC(+) (I). The quantification of apoptotic cells with the TUNEL assay (J) showed that apoptotic cell number increased in a BAC concentration-dependent manner. BAC at 0.01% and the four BAC-containing
formulations KETO-BAC(+), OPA-BAC(+), EPI-BAC(+) and LEVO-BAC(+) showed much higher expression of apoptotic TUNEL-positive
cells than did the unpreserved formulations NAA-BAC(-), CRO-BAC(-), KETO-BAC(-) at 24 h. Results are expressed as cell number
per mm of epithelial length (mm.E.L.): Mean±SD *Statistically significant compared to PBS with p<0.0014. **Statistically significant
compared to 0.01% BAC with p<0.0014. †Statistically significant compared to EPI-BAC(+) with p<0.0014. $Statistically significant
compared to LEVO-BAC(+) with p<0.0014.
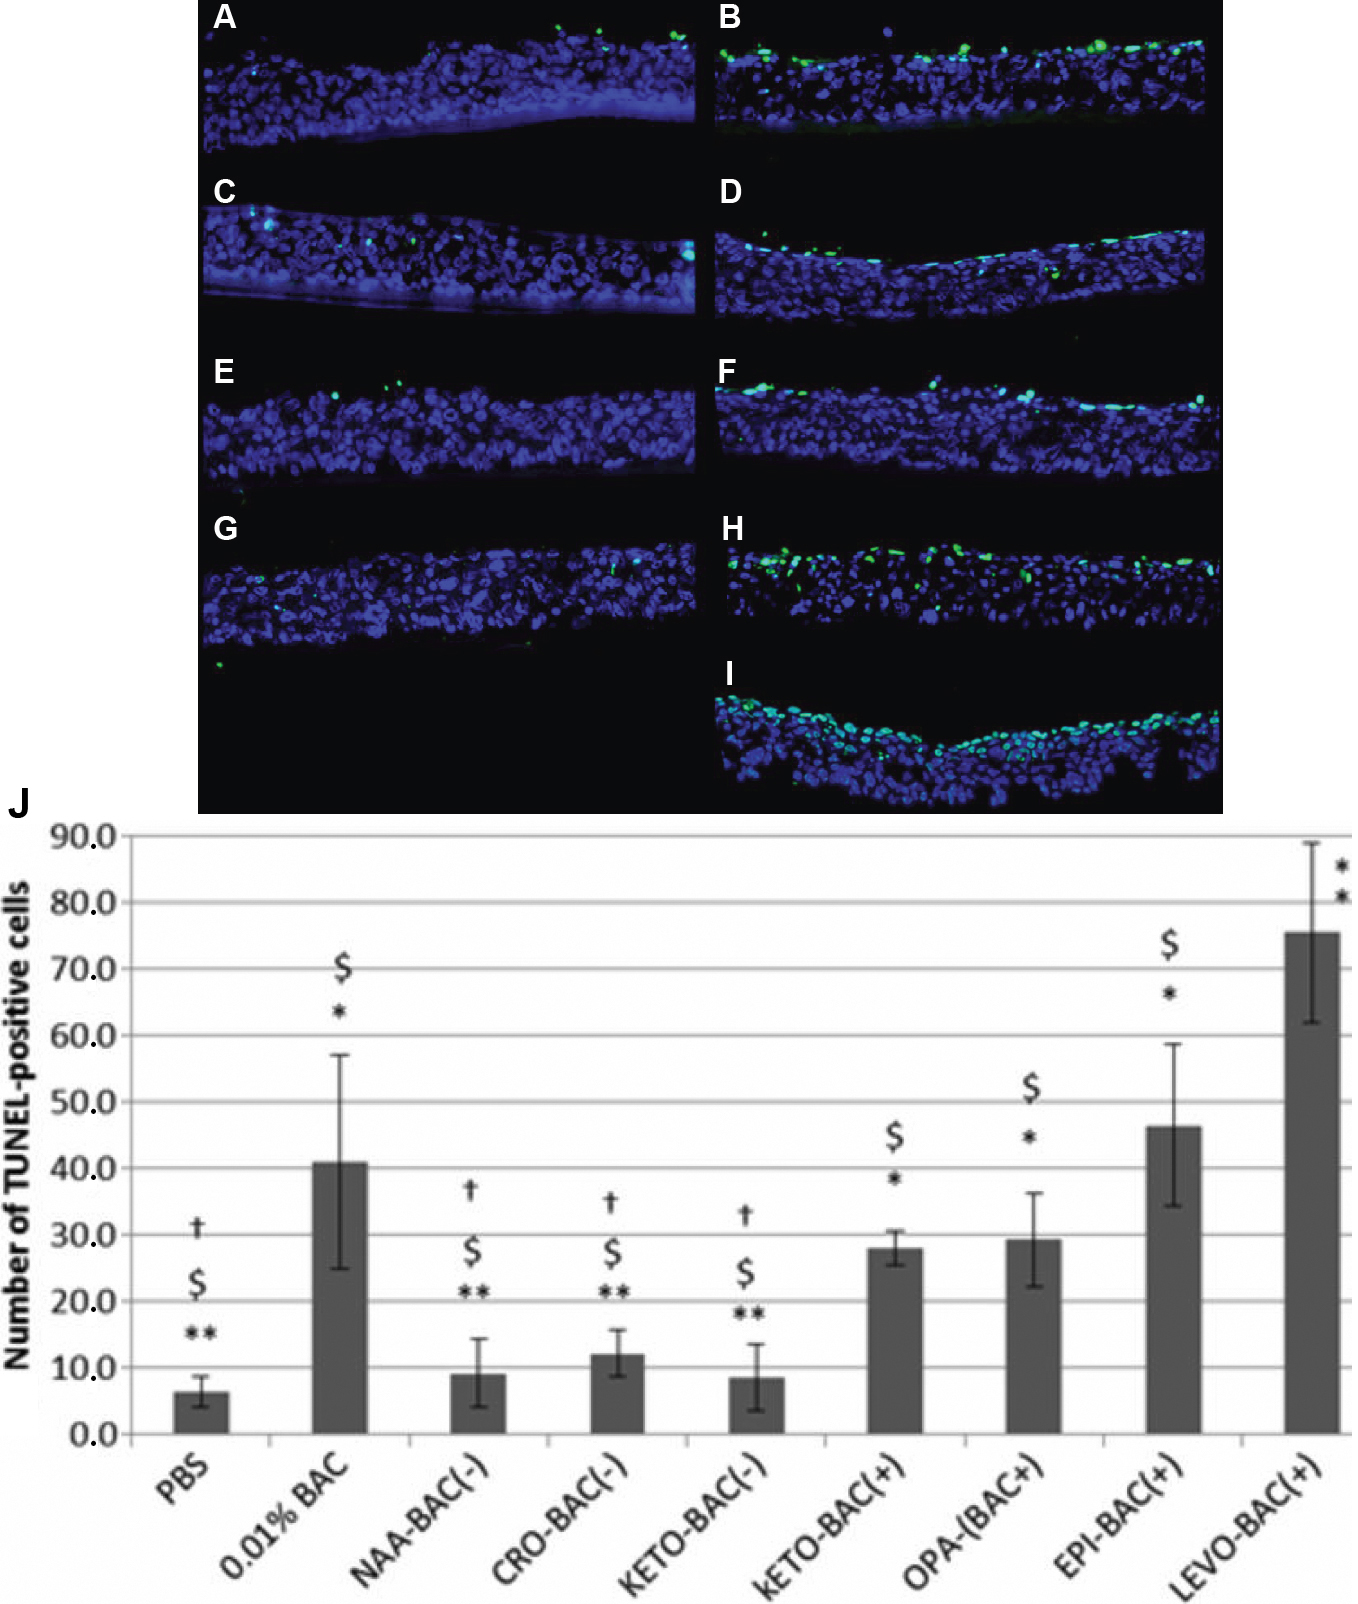
 Figure 2 of
Pauly, Mol Vis 2011; 17:745-755.
Figure 2 of
Pauly, Mol Vis 2011; 17:745-755.