Figure 3. Expression of Vsx1 in postnatal mouse retinal and corneal samples relative to P21 levels from qRT–PCR. Three animals were used for each time
point. The y-axis shows Vsx1 expression relative to expression on postnatal (P) day 21. x-axis shows postnatal day, tissue, and Vsx1 primer set number.
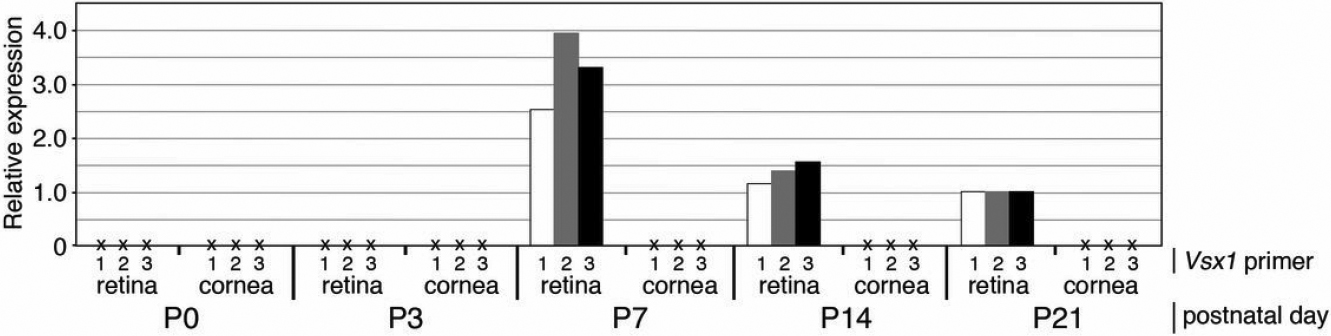
 Figure 3 of
Watson, Mol Vis 2011; 17:737-744.
Figure 3 of
Watson, Mol Vis 2011; 17:737-744.