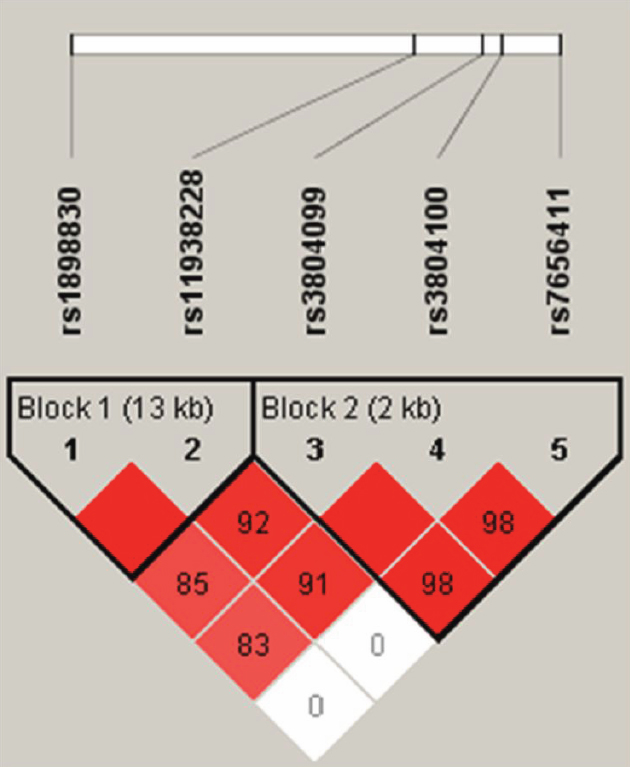
Figure 1. Linkage disequilibrium plot of five SNPs of
TLR2 in sarcoidosis patients and healthy controls. The schematic of the
TLR2 gene is shown as a black line, with boxes representing its three exons. The locations of the selected SNPs are indicated
by the dotted lines. The Haplotype blocks were determined using the
Haploview 4.2 software. Each box provides estimated statistics of the coefficient of determination, with brighter red representing
a stronger Linkage disequilibrium. Values in squares represent pairwise D’ values.
 Figure 1 of
Sato, Mol Vis 2011; 17:731-736.
Figure 1 of
Sato, Mol Vis 2011; 17:731-736.