Figure 2. Comparison and quantification of lens opacity among groups of UVB (UVB exposure without dietary zerumbone), UVB/ZER (UVB exposure
with dietary zerumbone at 1, 10, and 100 mg/kg respectively), and blank control (no UVB exposure and no dietary zerumbone).
A-E: Severe cataract formation was seen in the UVB-irradiated lens in (A) and its corresponding negative image, which was reversed with zerumbone supplementation as shown in (C) and (D). F: Lens opacity scoring showed the inhibitory effect of zerumbone on cataract formation. Scale bar: 1.25 mm.
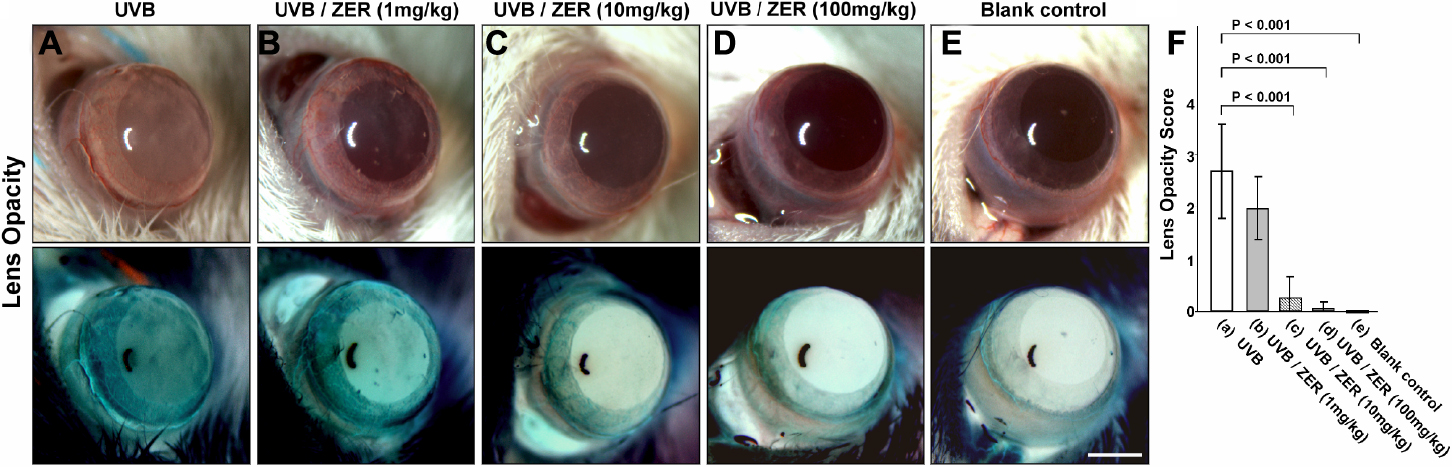
 Figure 2 of
Chen, Mol Vis 2011; 17:723-730.
Figure 2 of
Chen, Mol Vis 2011; 17:723-730.