Figure 8. Hydrophobicity analysis. A: Comparision of hydrophobicity between wild type and mutant CRYGC. The protscale online software predict the effect of substitution
on CRYGC protein hydrophobicity. Hydrophobicity of mutant protein increases around mutation point (R48H). B: Comparision of hydrophobicity between wild type and mutant GJA8. The protscale online software predict the effect of substitution
on GJA8 protein hydrophobicity. Hydrophobicity of mutant protein increases around mutation point (L281C).
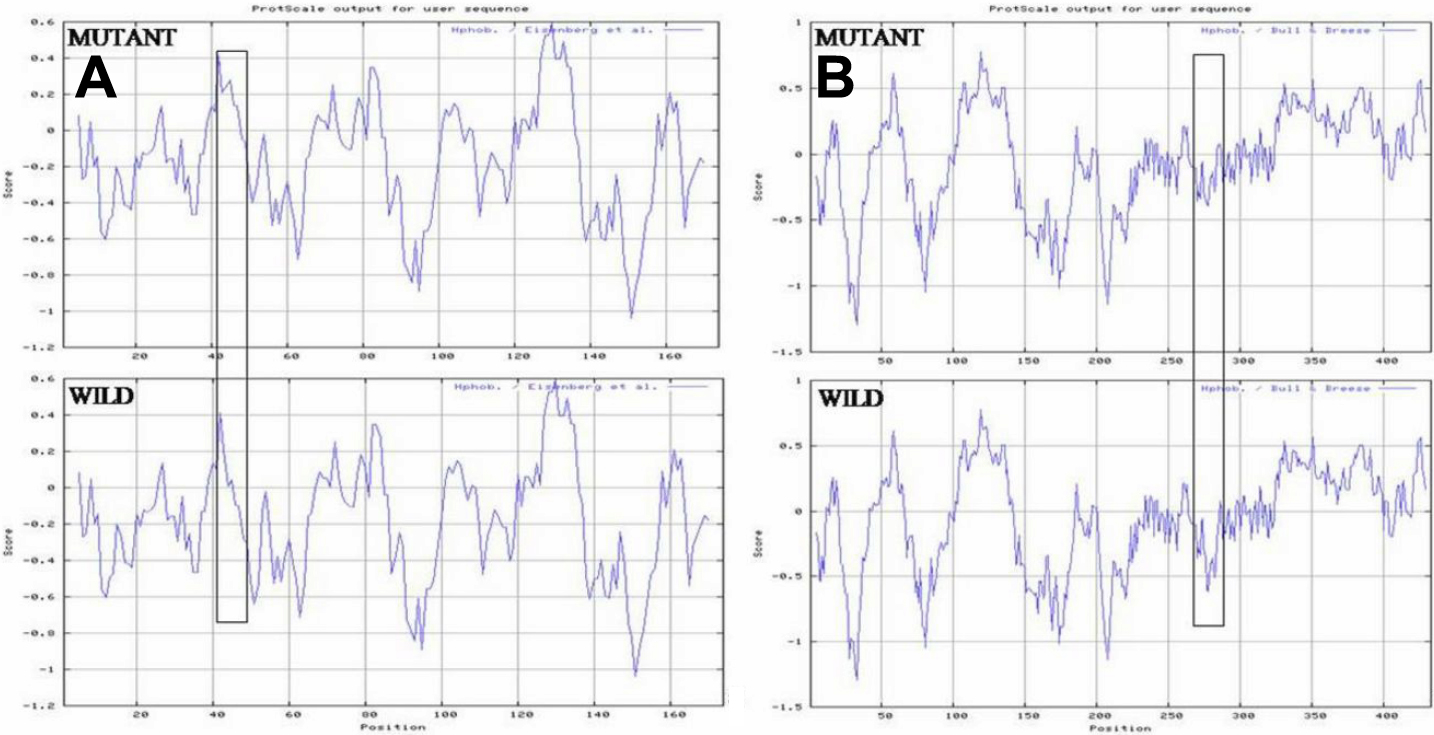
 Figure 8 of
Kumar, Mol Vis 2011; 17:693-707.
Figure 8 of
Kumar, Mol Vis 2011; 17:693-707.