Figure 10 of
Kumar, Mol Vis 2011; 17:693-707.
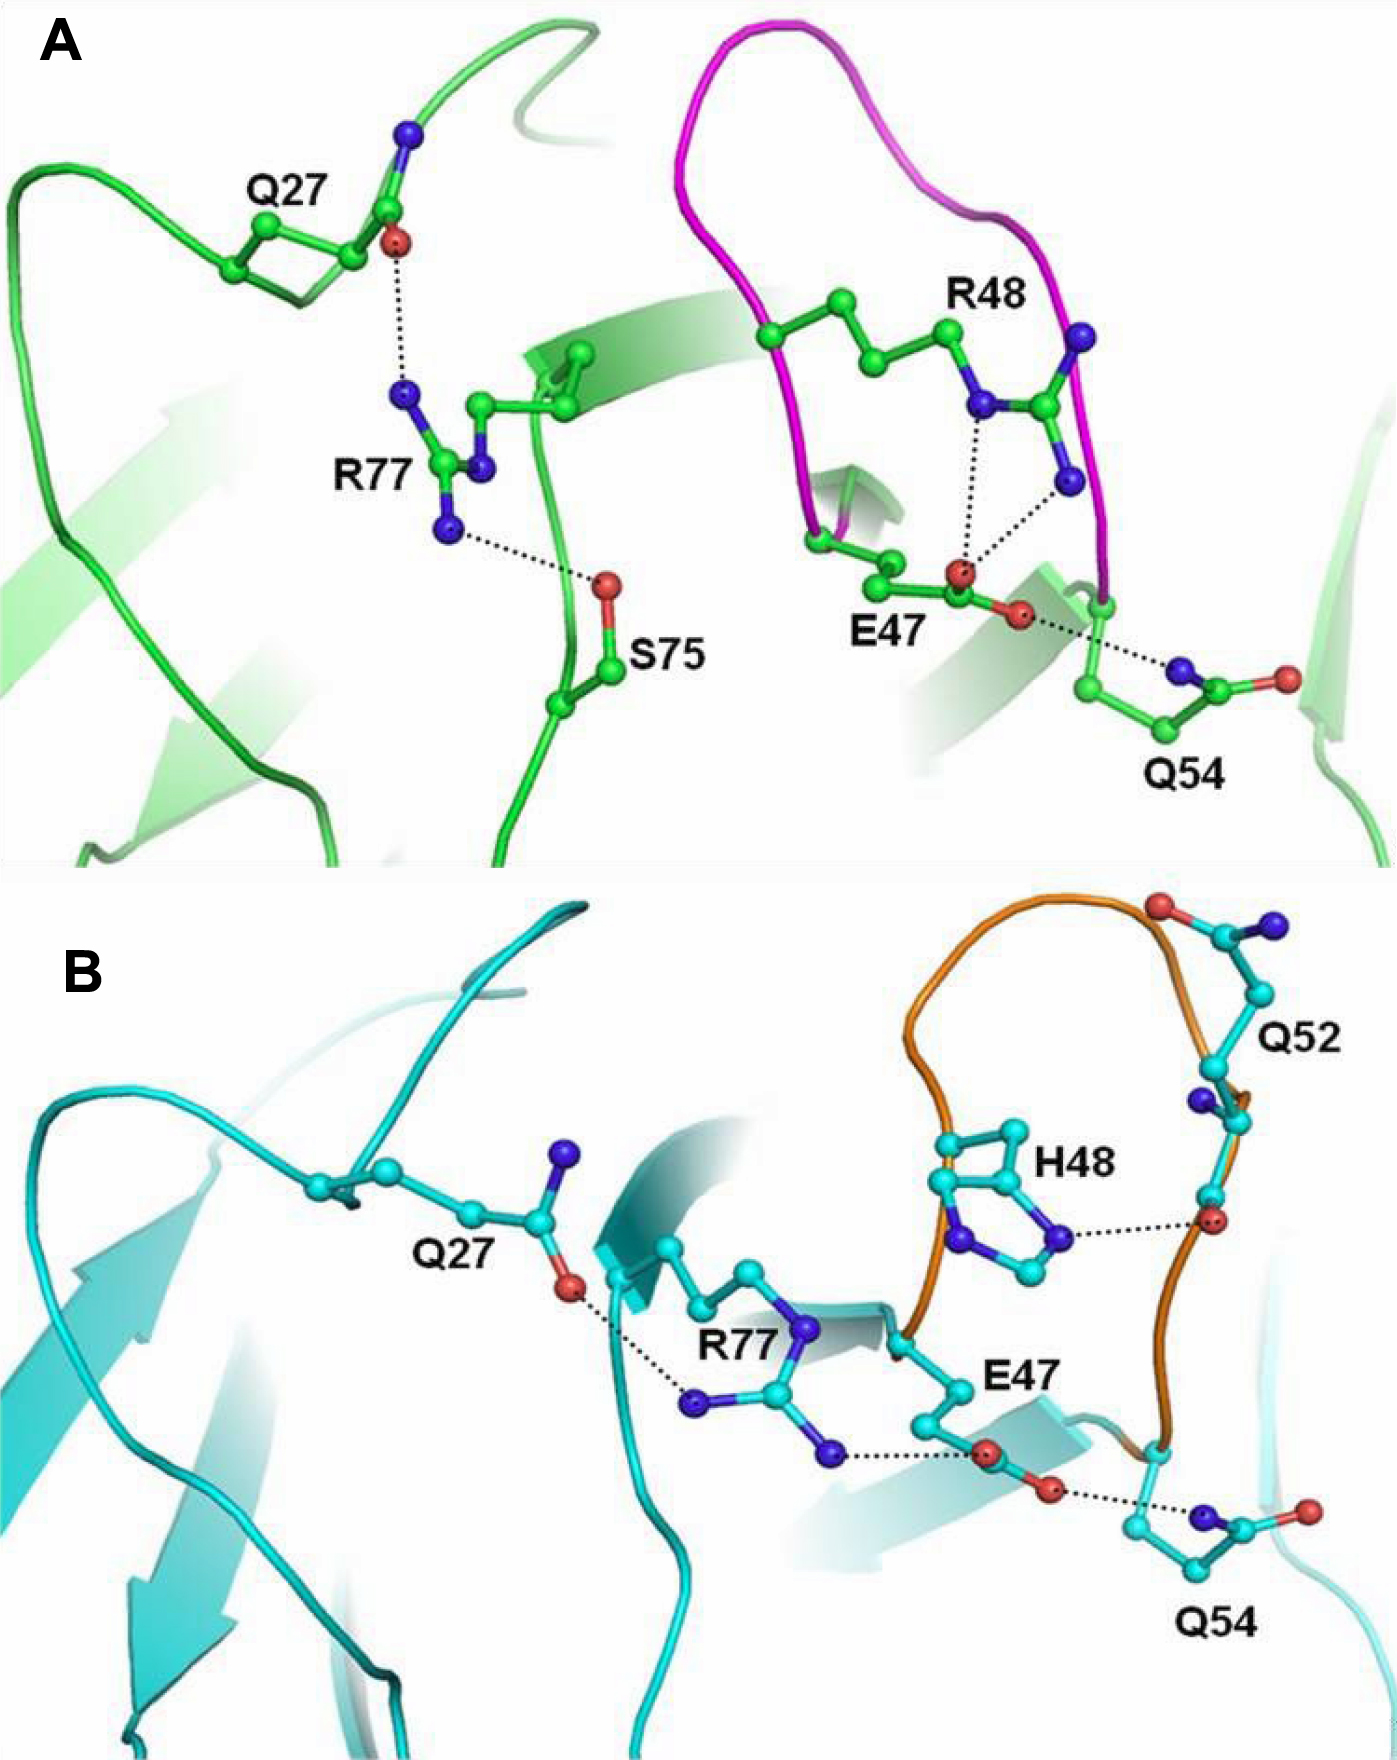
Figure 10.
Hydrogen bond interactions.
A
: Conformation of loop3 (in magenta) in wild type human γC-crystallin.
B
: Conformation of loop3 (in orange) in mutant (R48H) human γC-crystallin.
 Figure 10 of
Kumar, Mol Vis 2011; 17:693-707.
Figure 10 of
Kumar, Mol Vis 2011; 17:693-707.