Figure 4. Relative gene expression of muscarinic receptor 1-5 to the corresponding atropine treated mRNA level with and without myopia.
A: Bar graph depicting the relative gene expression of muscarinic receptor 1–5 of myopic (MS) and atropine treated myopic (AMS)
sclera ∆CT values to the corresponding normal saline treated (NSMS) sclera mRNA level after normalization with 18S rRNA internal standard.
Similar analysis method was applied to the control group (NSMCS). The mRNA level of M1, M3, and M4 after atropine treatment in the experimental myopic sclera (AMS) was upregulated and some change observed in the atropine
treated control (AMCS) whereas down regulated during myopia (MS) and after receiving saline (NSMS). The mRNA levels of M2 and M5 after induction of myopia were upregulated and reversed (down-regulated) in atropine treated group. Data was represented
as mean±SD B: Bar graph depicting the relative gene expression of muscarinic receptor 1–5 of myopic (MS), atropine treated myopic (AMS)
and normal saline treated myopic (NSMS) sclera ∆CT values to the corresponding their own contra-lateral control mRNA level (CS, AMCS, and NSMCS, respectively) after normalization
with 18S rRNA internal standard. The mRNA levels of M1, M3, and M4 after induction of myopia and treated with normal saline were down regulated and reversed (upregulated) in atropine treated
group. The mRNA levels of M2 and M5 after induction of myopia and treated with normal saline were upregulated and reversed down-regulated in the atropine treated
sclera. Data was represented as mean±SD C: Bar graph depicting the relative gene expression of muscarinic receptor 1–5 of cerebellum, myopic (MS), atropine treated
myopic (AMS), normal saline treated myopic (NSMS), contra-lateral control (CS), atropine treated control (AMCS) and normal
saline treated control (NSMCS) sclera ∆CT values to the corresponding the naive sclera (S) mRNA level after normalization with 18S rRNA internal standard. The mRNA
levels of M1, M3, and M4 after induction of myopia and treated with normal saline were down regulated and reversed (upregulated) in atropine treated
group. The mRNA levels of M2 and M5 after induction of myopia and treated with normal saline were upregulated and opposite in the atropine treated group. Data
was represented as mean±SD.
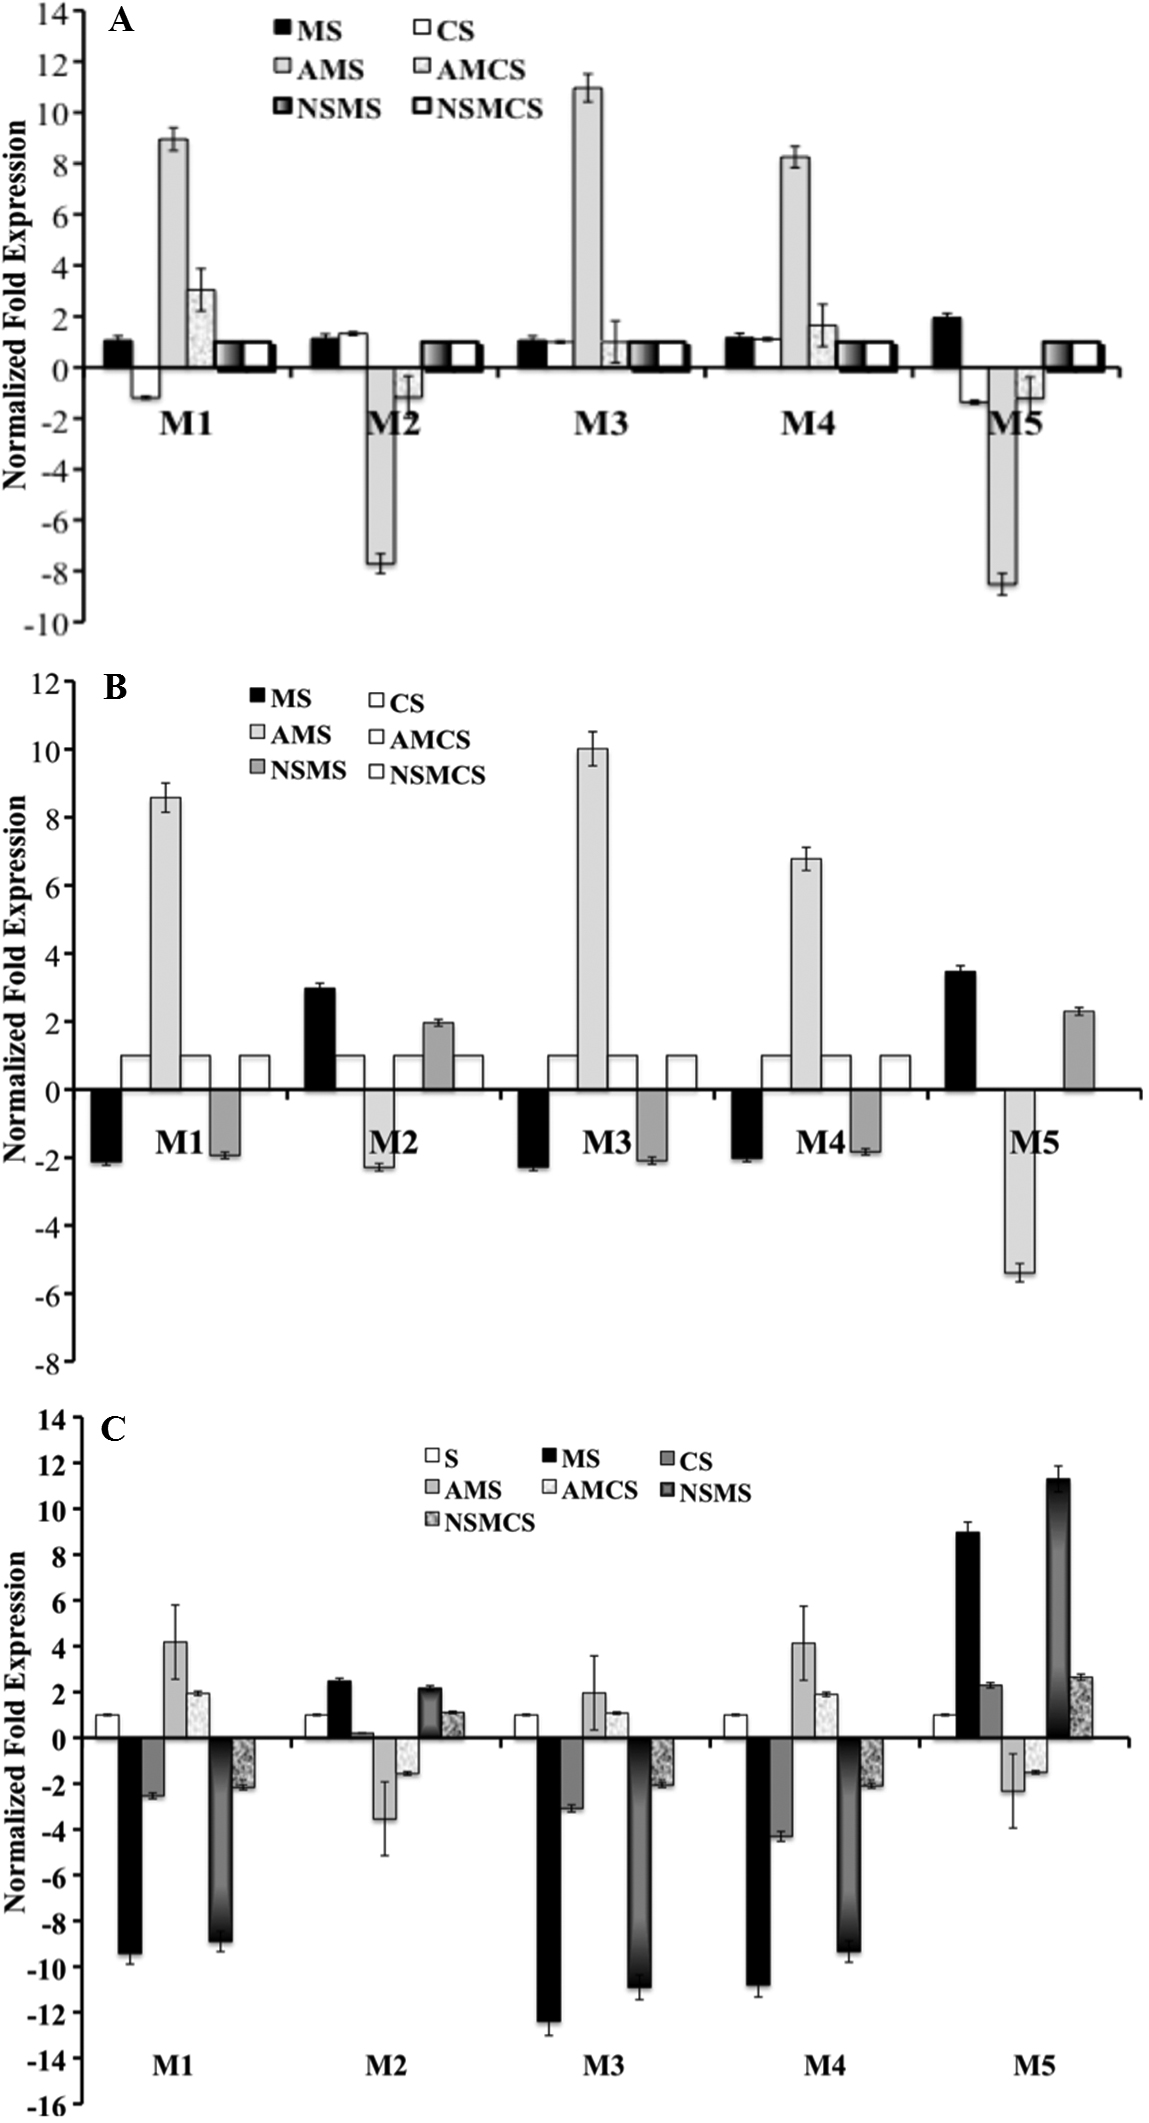
 Figure 4 of
Barathi, Mol Vis 2011; 17:680-692.
Figure 4 of
Barathi, Mol Vis 2011; 17:680-692.