Figure 6. Percentage of the surface area covered by K12 and K8 positive cells. The mean surface area covered by K12 positive cells (red
bars) was significantly higher in limbal fibroblast conditioned media compared to the skin conditioned media and DMEM groups
(**p<0.001). Similarly, the mean surface area covered by K8 positive cells (green bars) was significantly lower in the limbal
conditioned media group compared to the skin conditioned media and the DMEM groups (*p<0.01). The error bars represent the
standard deviation.
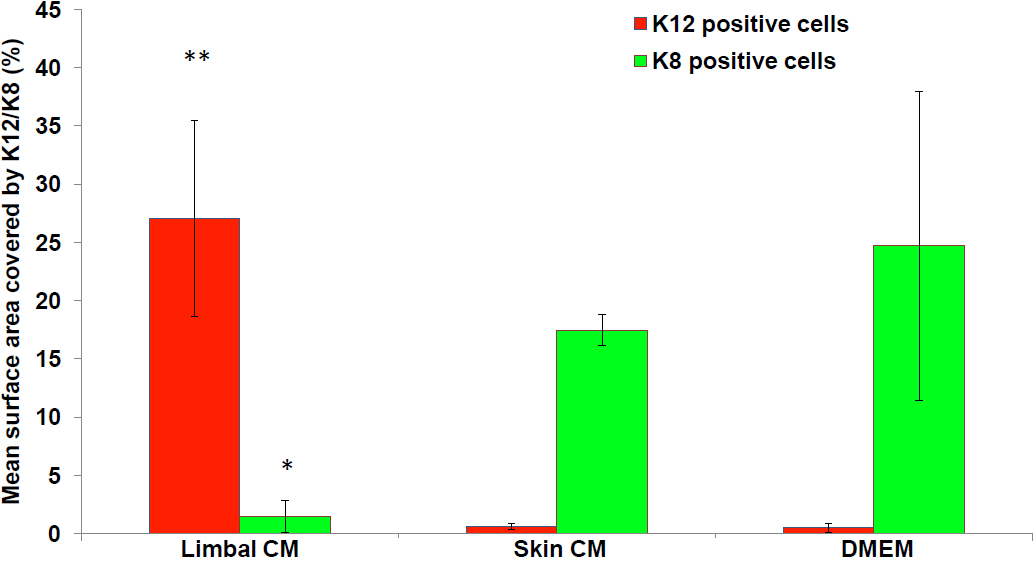
 Figure 6 of
Amirjamshidi, Mol Vis 2011; 17:658-666.
Figure 6 of
Amirjamshidi, Mol Vis 2011; 17:658-666.