Figure 5. Effect of BMP-2 on production of
collagen I and aggrecan. The mRNA (A) and protein (B)
expression levels for collagen I and aggrecan were significantly
increased with 100 ng/ml BMP-2, 72 h in vitro. Bar graphs revealed
changes in mRNA and protein expressions (mean±standard error of the
mean) where values were stated as relative expression levels. C:
control group, T: BMP-2 treatment group. The asterisk stands for
p<0.05 and the double asterisk stands for p<0.01.
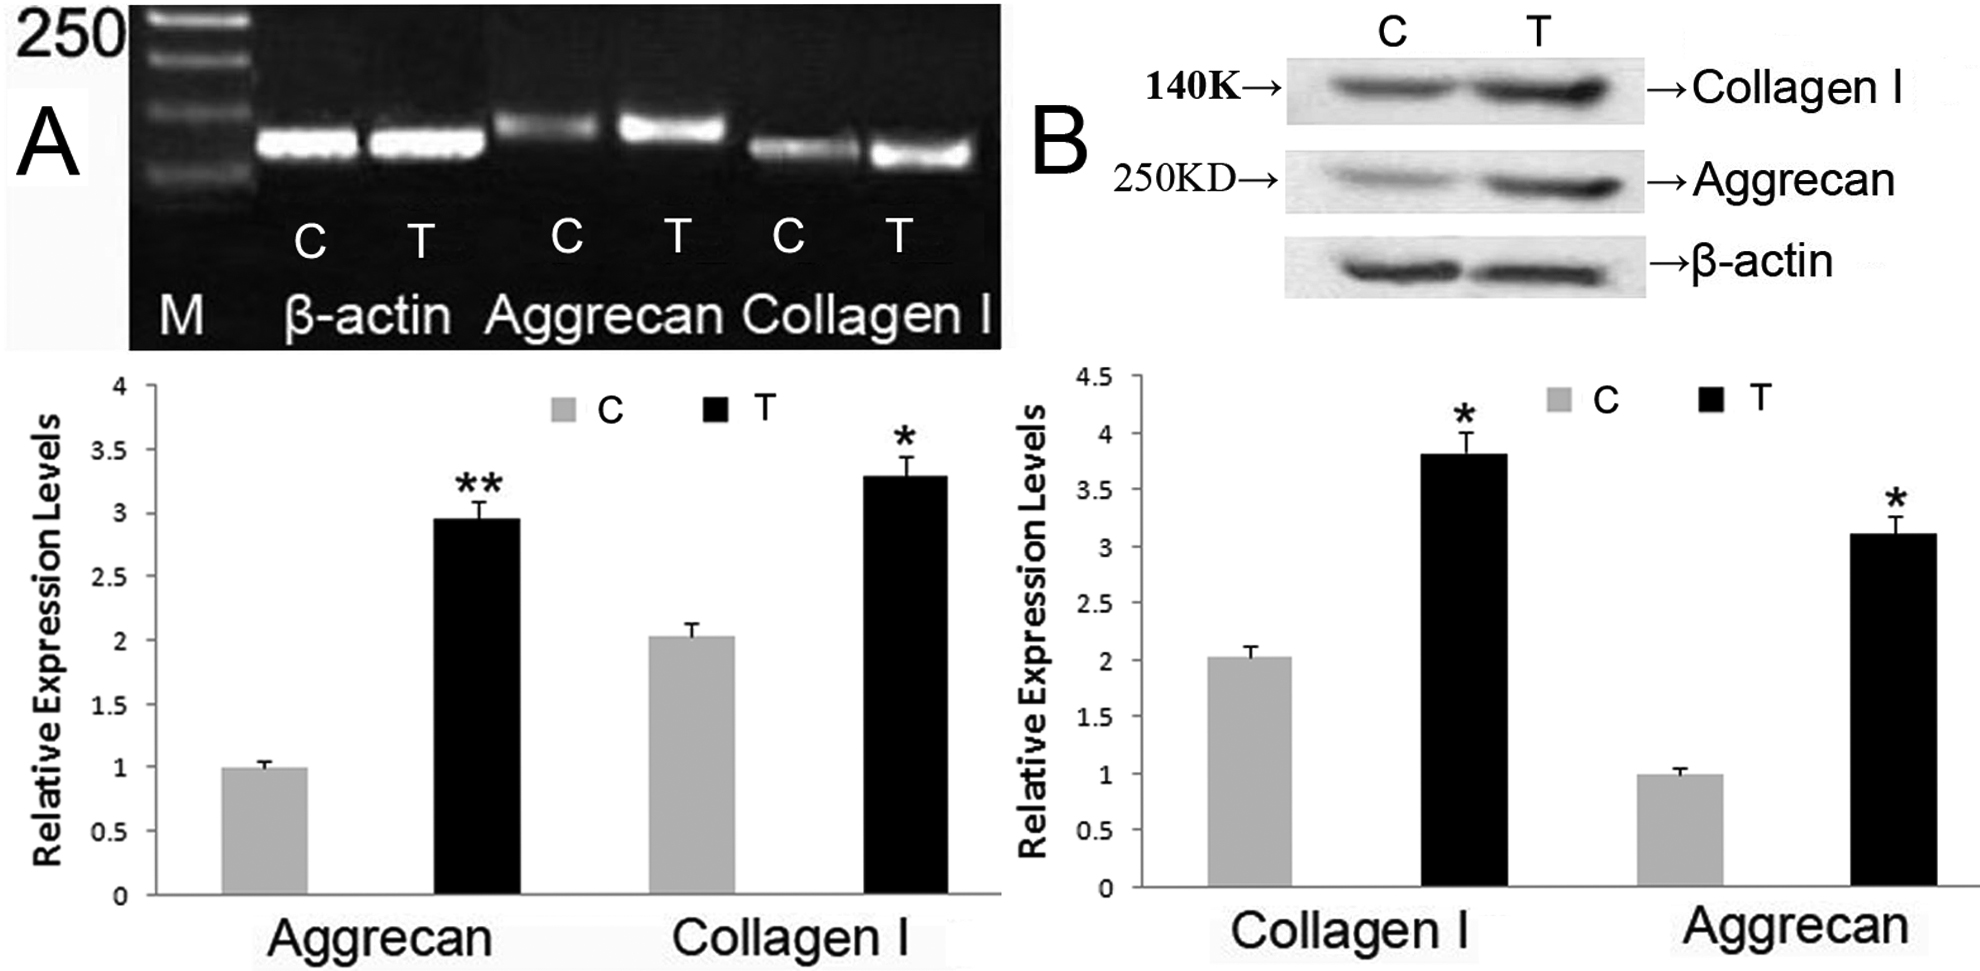
 Figure 5 of Wang, Mol Vis 2011; 17:647-657.