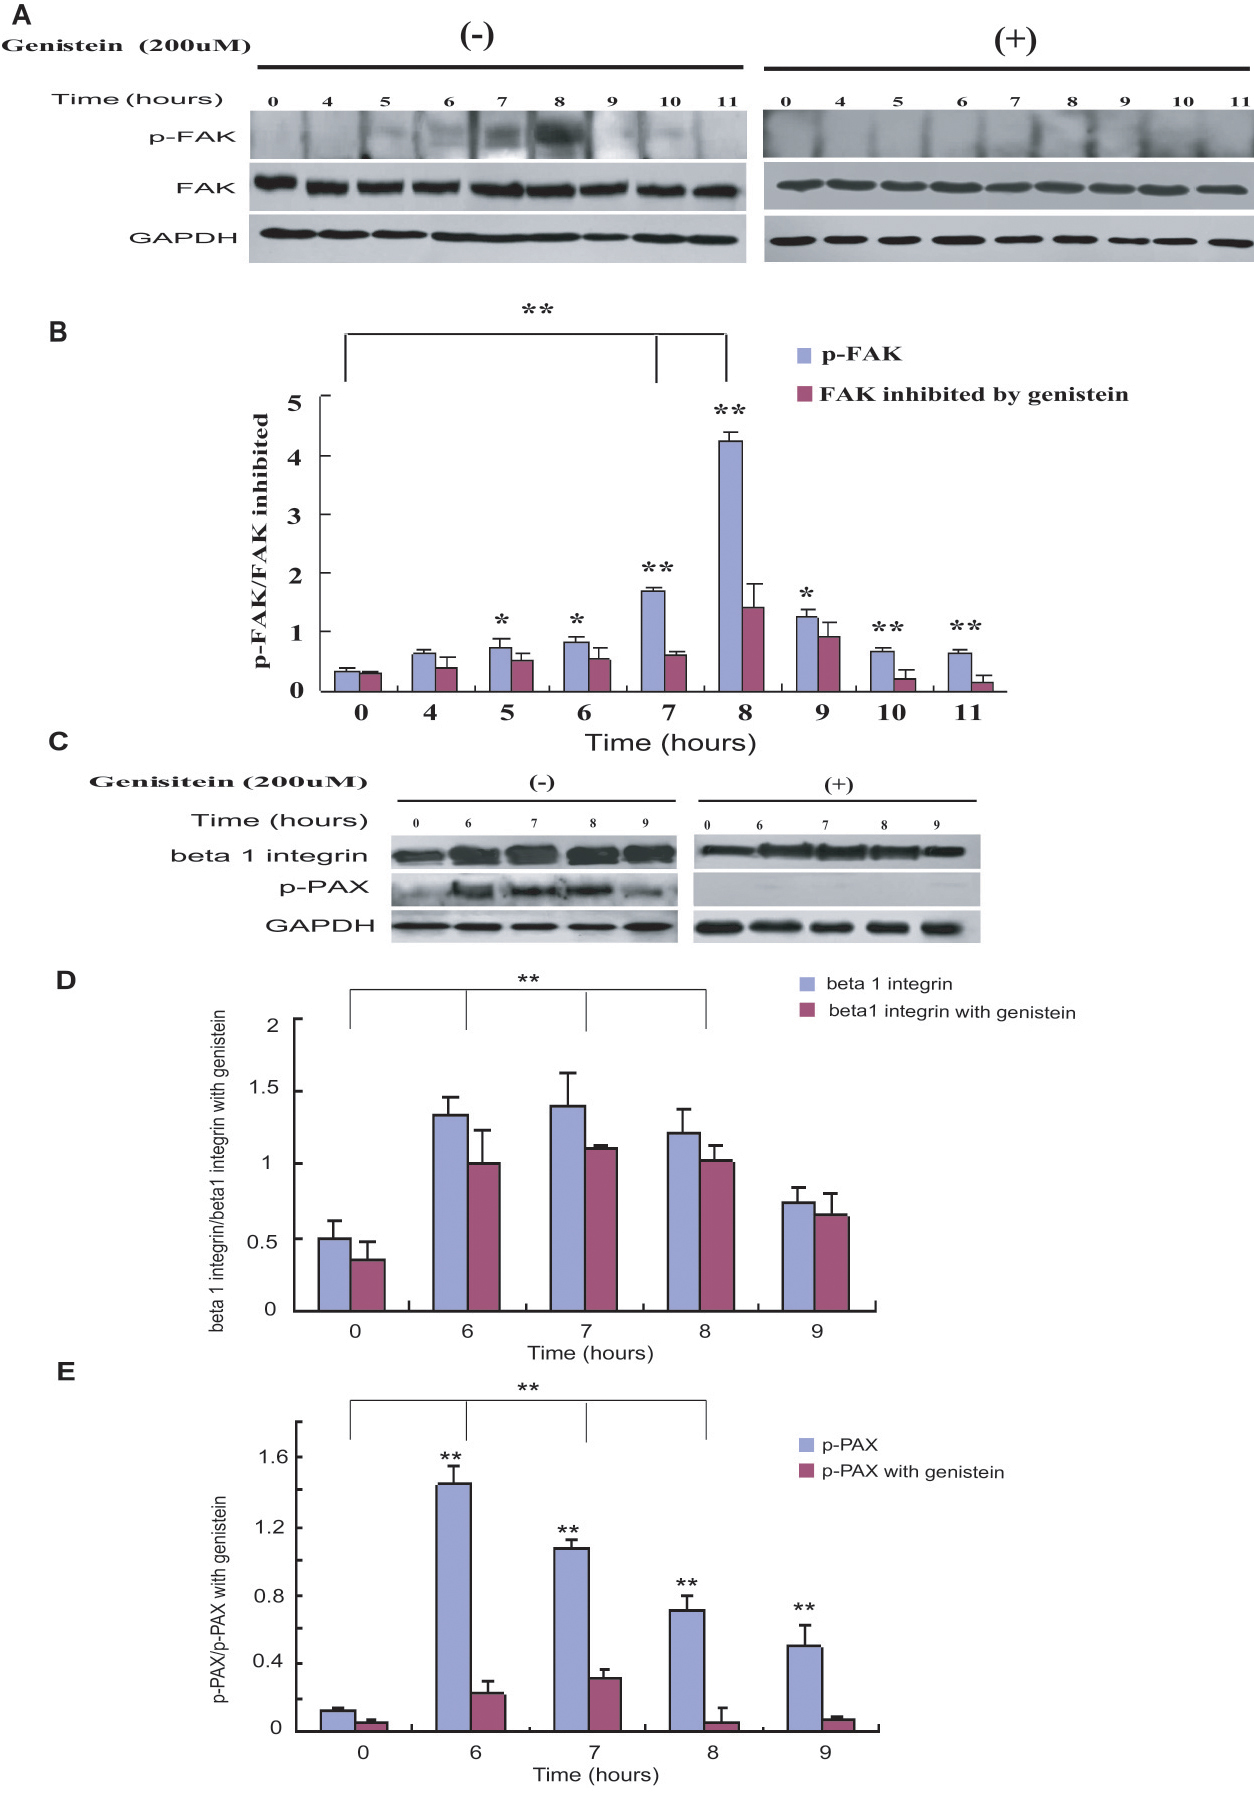
Figure 6. Involvement of FAK phosphorylation and integrin signaling with adhesion of HCECs to
F. solani spores. After pretreatment with/without genistein, HCECs were exposed to
F. solani spore suspensions. Western blot assay showed that 5 h after incubation, p-FAK production was significantly increased (
A). The graph (
B) compares scanning signal intensity of p-FAK expression by
ImageJ software. The expression of p-FAK greatly increased (p<0.001) in all treated groups (7 and 8 h). There were significant differences
for the phosphorylation levels of FAK in all treated groups. *p<0.01, **p<0.001. The β1 integrin and p-PAX from cells incubated
with
F. solani spores were also analyzed by western blot (
C). The graph (
D) compared scanning signal intensity of β1 integrin expression by ImageJ software and indicated the significant overexpression
(p<0.001) of β1 integrin protein in all treated groups (6, 7, and 8 h). The data showed no significant differences (p<0.05)
between the genistein treated and non-treated groups. The expression of p-PAX was significantly increased (p<0.001) in all
treated groups and when the cells were pretreated with genistein, the expression of p-PAX was significantly lower (p<0.001)
than in the no-genistein treated group (
E). GAPDH was used as a loading control.
 Figure 6 of
Pan, Mol Vis 2011; 17:638-646.
  Figure 6 of
Pan, Mol Vis 2011; 17:638-646.