Figure 4. Flow cytometry analysis results
for the expression of β1 integrin. The data evaluated the expression of
β1 integrin on permeabilized HCECs by flow cytometry. As shown in the
figure, the anti-β1 integrin, mAb, positively stained cells both in the
group incubated with F. solani spores and in the genistein
pretreated groups (97.97% and 83.60%, respectively), while 56.43% of
the cells were positive in the negative controls. Significant
differences were observed between the above two groups. The results
were representative of one of three separate experiments.
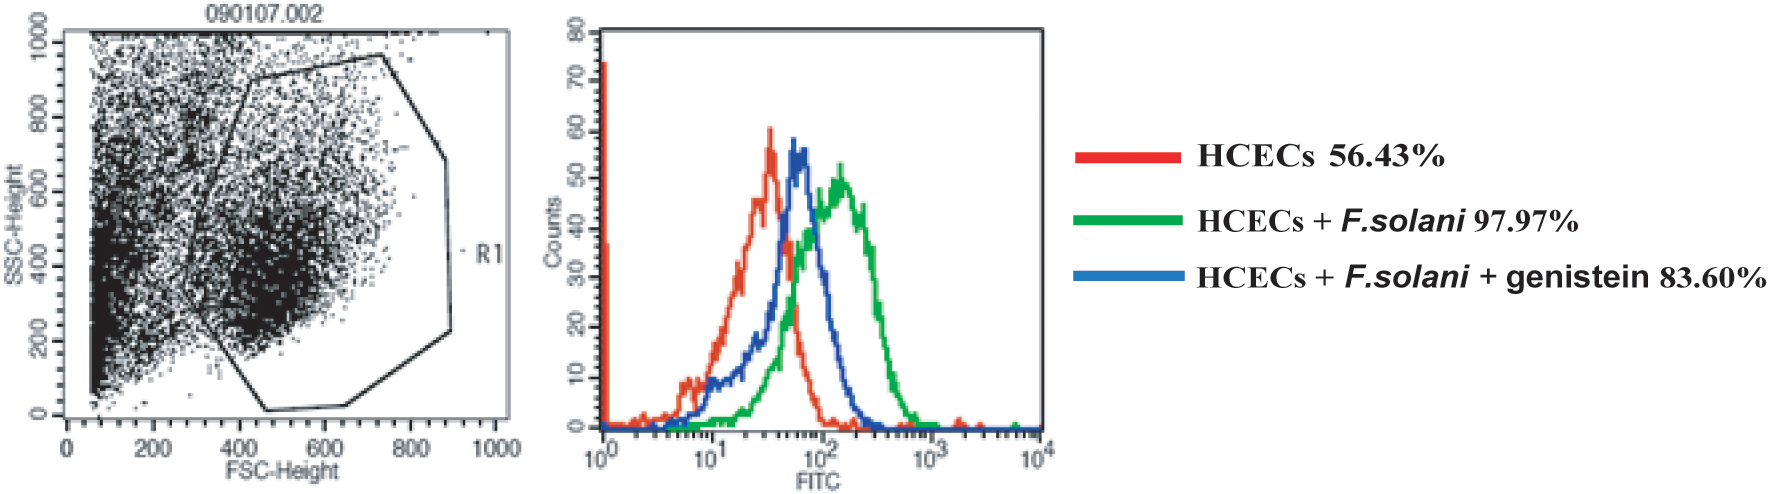
 Figure 4 of Pan, Mol Vis 2011; 17:638-646.