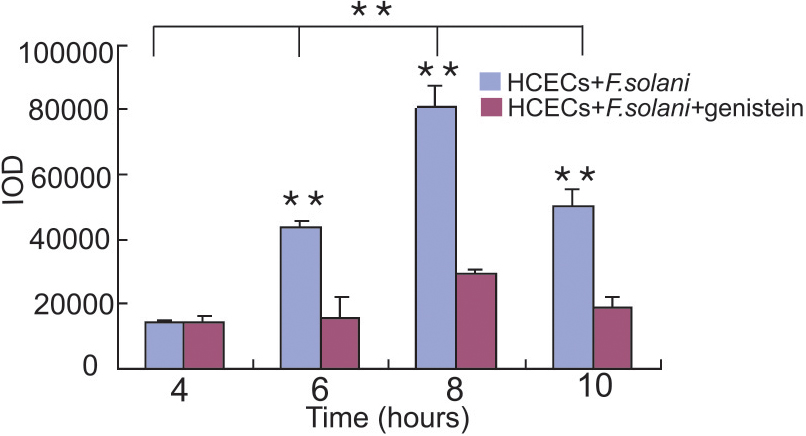
Figure 2. The comparison of optical density (IOD) levels between the F. solani and HCEC co-incubated group and the genistein treated group. Spore adhesion assays were performed by measuring the IOD. Statistical
significance was tested by one-way ANOVA and Student-Newman-Keul's test. The p values indicated significant differences between
the data in the experimental groups (6, 8, and 10 h) and their corresponding treated groups. **p<0.001.

 Figure 2 of
Pan, Mol Vis 2011; 17:638-646.
  Figure 2 of
Pan, Mol Vis 2011; 17:638-646.