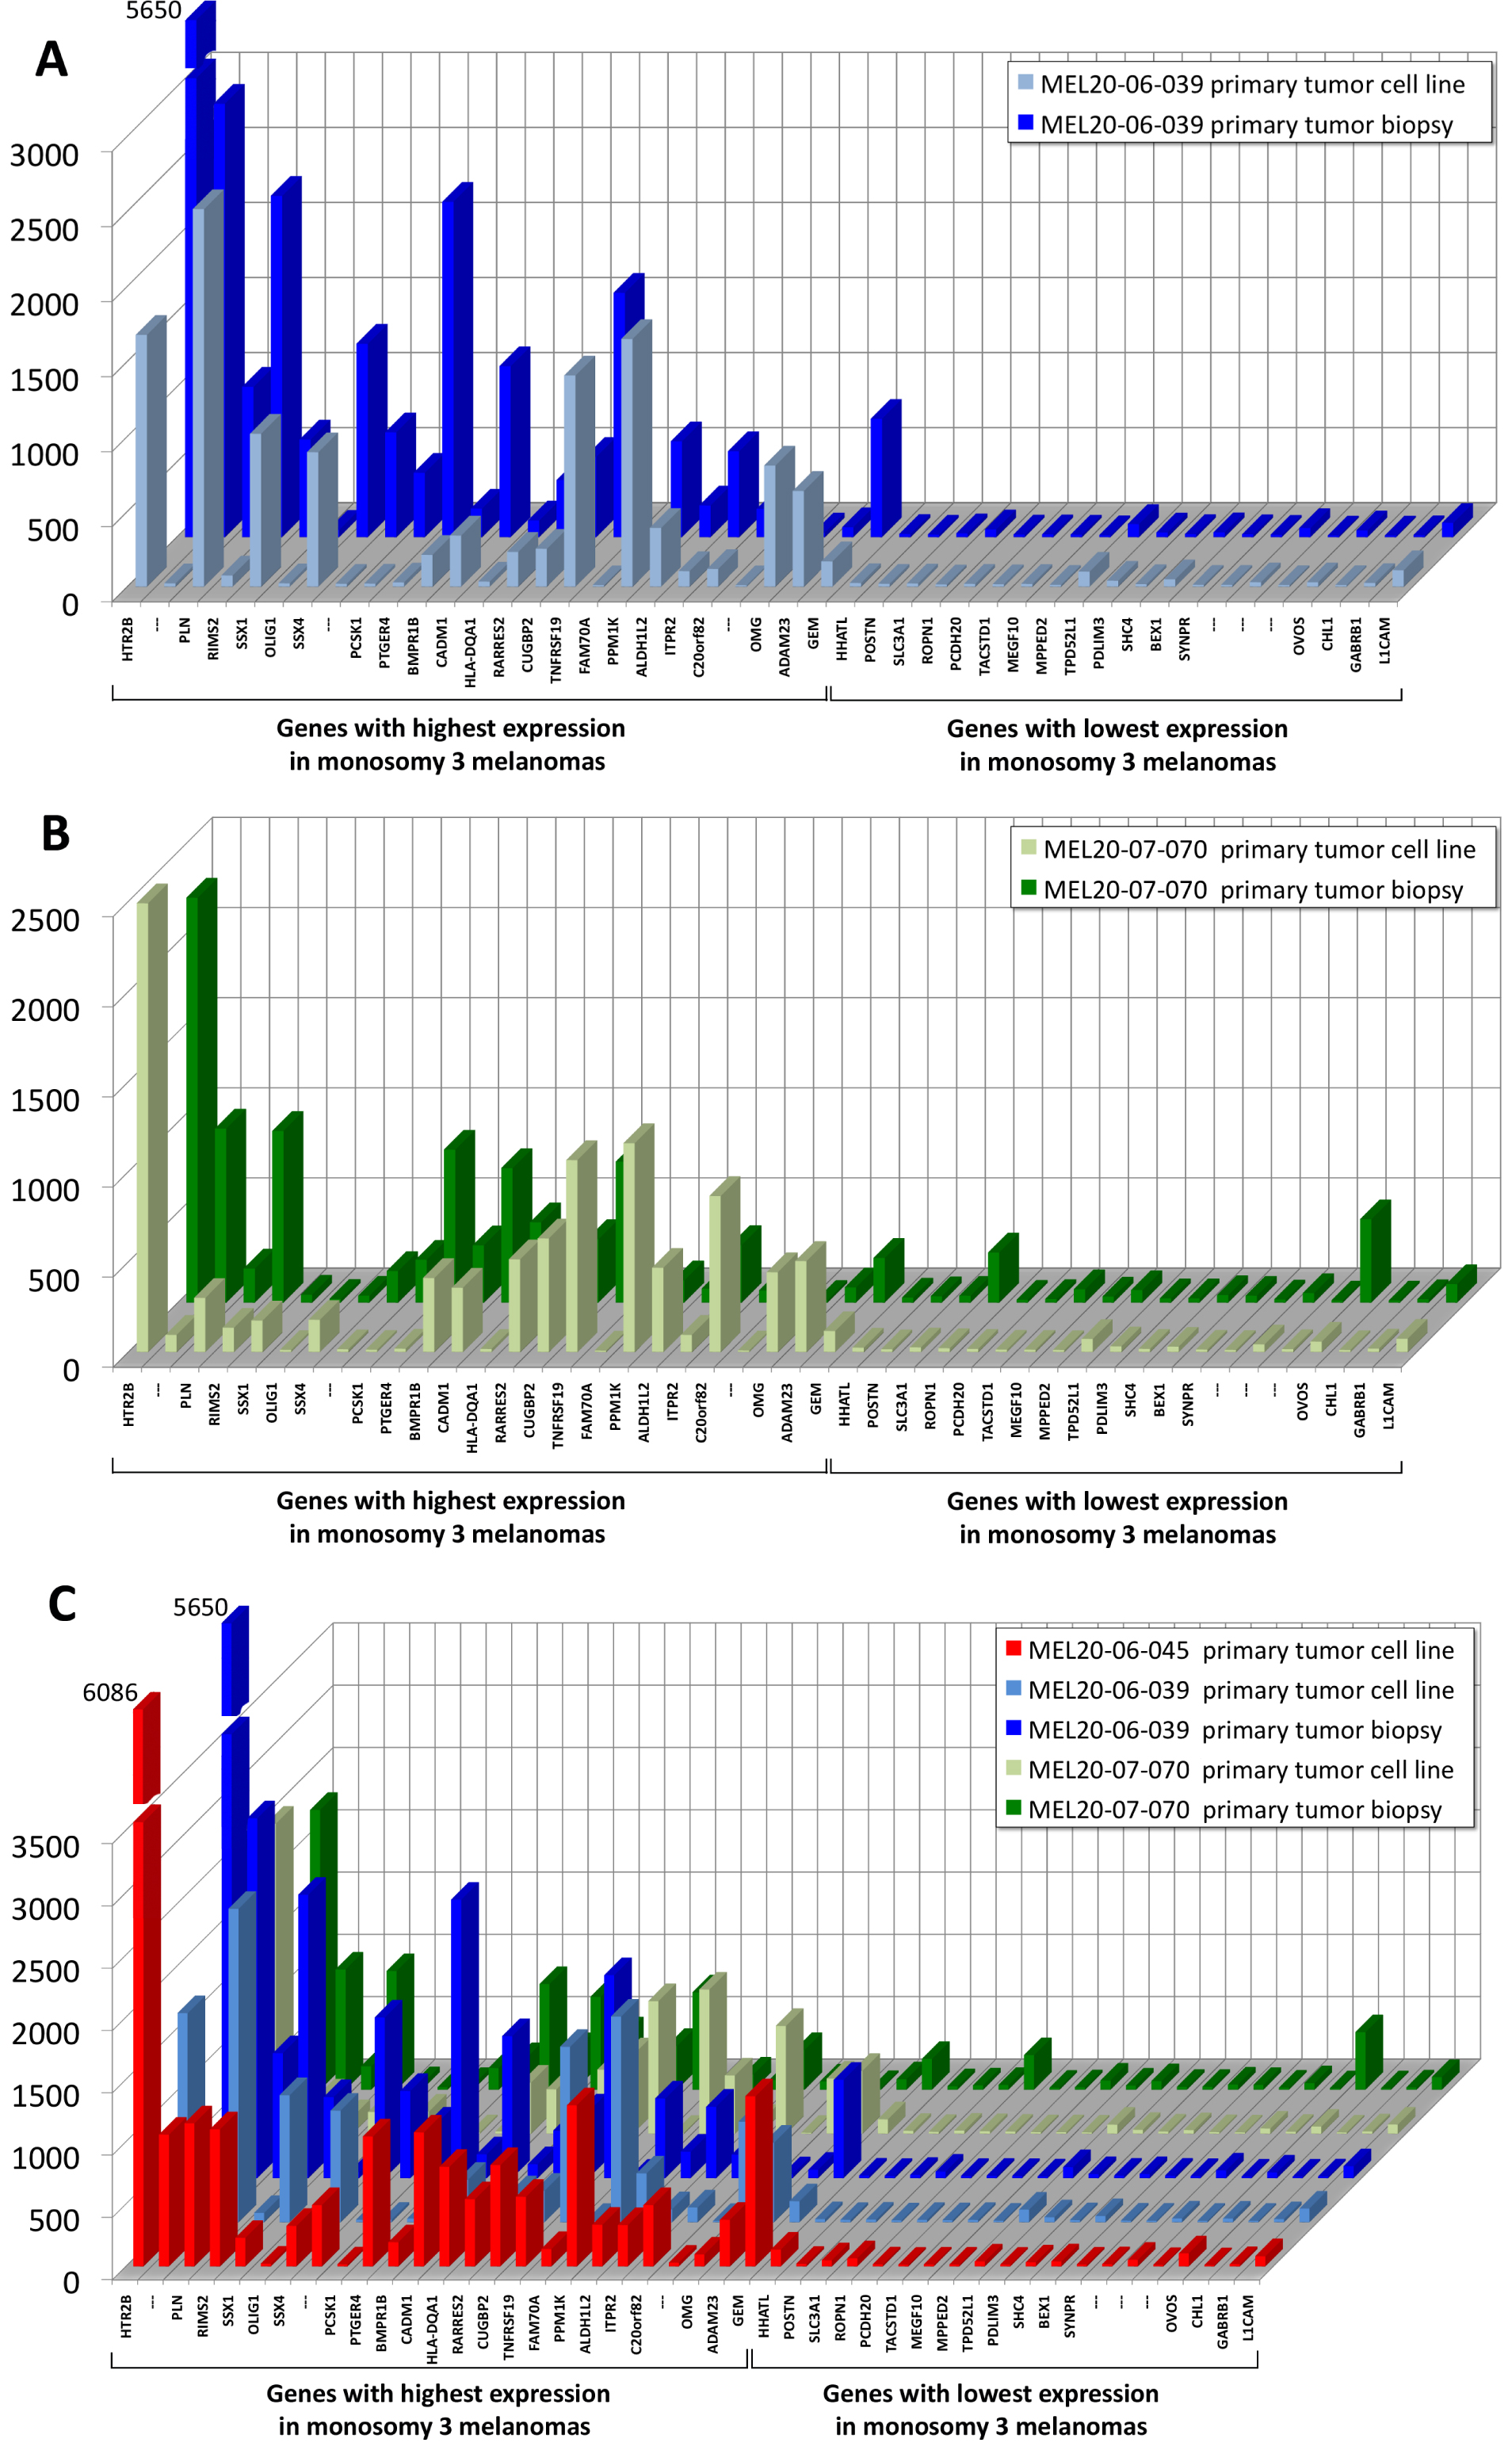
Figure 3. Comparison of expressional
characteristics between primary melanomas and their corresponding cell
lines. Normalized expressional values from Affymetrix GeneChip HG U133
plus 2.0 arrays for 25 genes significantly upregulated in monosomy 3
tumors and 20 genes significantly down-regulated or silenced in
monosomy 3 melanomas compared to melanomas with 6p gain in the absence
of chromosome 3 loss were selected to compare expressional variation
between primary tumor biopsies and the corresponding cell lines.
A:
MEL20–06–039;
B: MEL20–07–070;
C: MEL20–06–045 cell
line is shown in combination with MEL20–06–039 and MEL20–07–070 to
provide a comparison of this cell line’s expressional profile with
those for which primary tumor expressional characteristics are known.
Probeset identifiers and genomic locations of the listed genes are
detailed in
Table
2.
 Figure 3 of Burgess, Mol Vis 2011; 17:607-615.