Figure 2. Comparison of Mapping Array
results for chromosomal copy number for primary tumor biopsies and
their cell lines, where available. Copy number variation analysis, as
determined by Affymetrix Genotyping Console, showed identical patterns
of aberration between primary tumor biopsies and corresponding cell
lines. Gains (green boxes) and losses (red boxes) were largely whole
arm in extent. 2± designations signify a total of 4 or more copies of
chromosome 8q were detected. All samples had monosomy 3, 6q loss, 8p
loss, multiple gains in 8q, and 16q loss. MEL20–06–045 and MEL20–07–070
also had 6p gain.
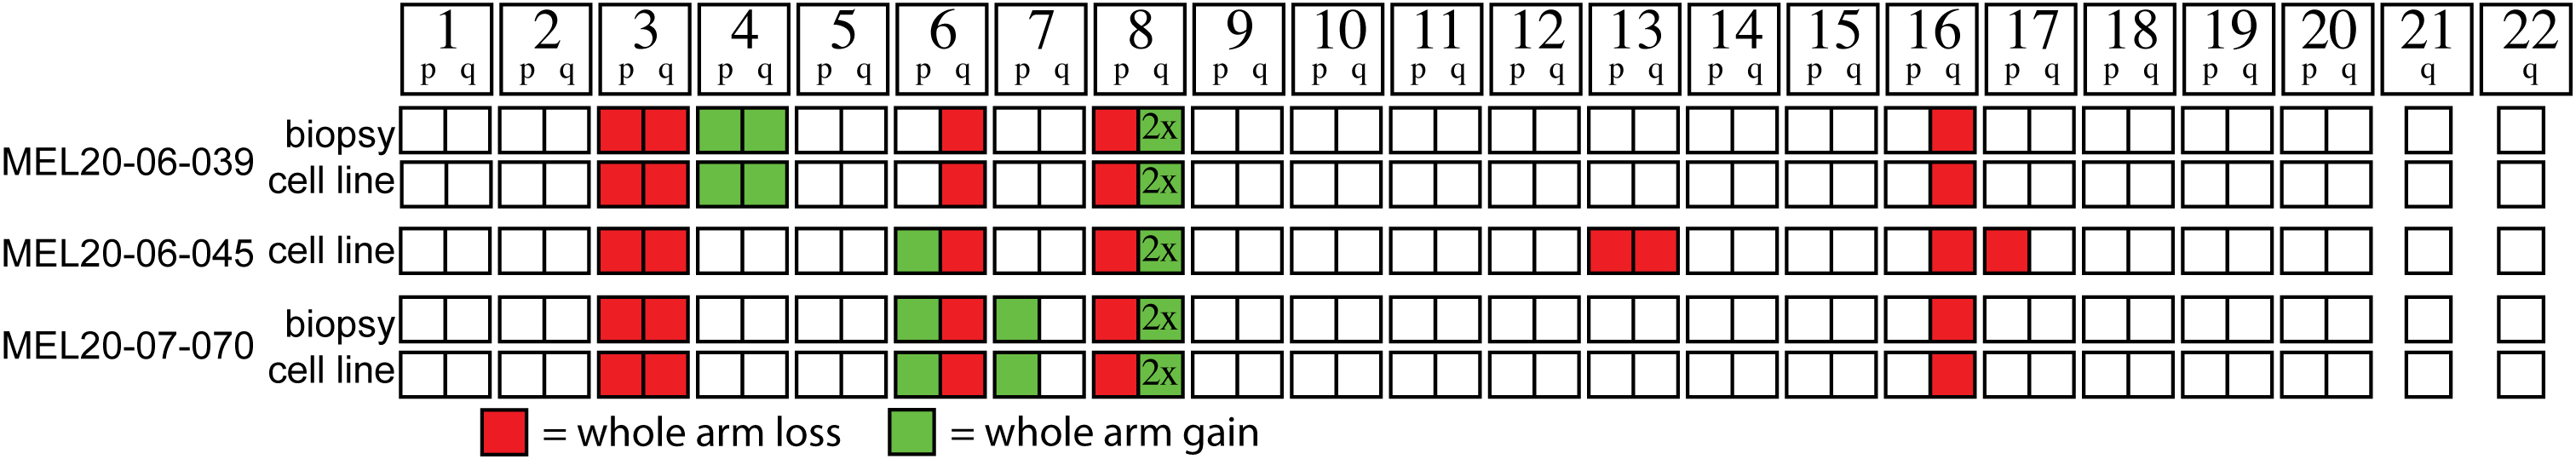
 Figure 2 of Burgess, Mol Vis 2011; 17:607-615.