Figure 2. Radial sections demonstrating
second-harmonic generation and autofluorescence of the TM region of a
human eye. Multiple tiled scans were performed and projected into three
dimensions. Shown here are snapshots every 15° of rotation about the
y-axis. As the tissue rotates about the y-axis, the scleral spur, iris
root (white arrow) and attached TM tissue (dotted lines) can be seen
with considerable detail. Schlemm’s canal (red circle) can be seen
clearly adjacent to the TM. White bar=200 µm.
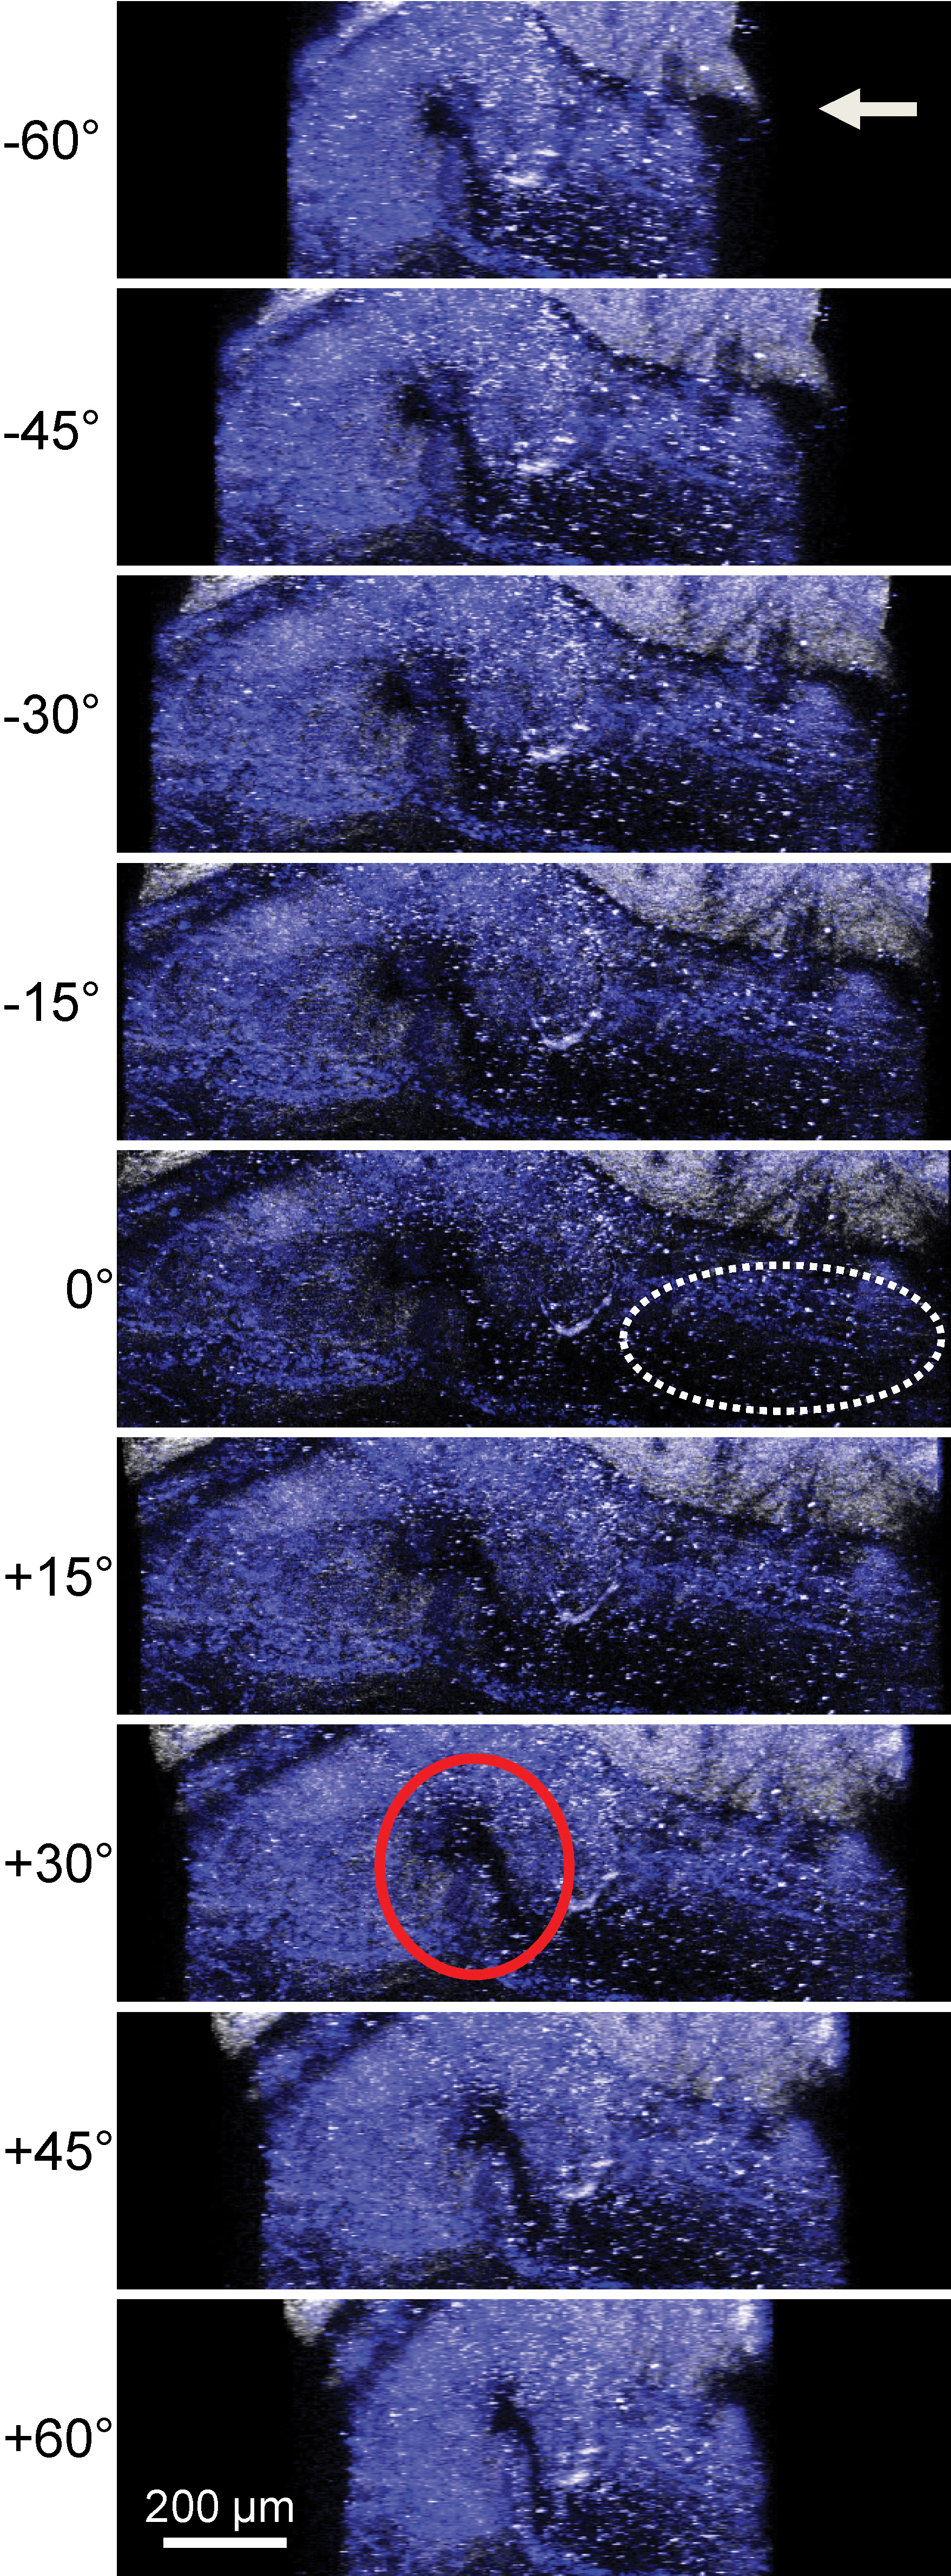
 Figure 2 of Ammar, Mol Vis 2011; 17:583-590.