Figure 2. A schematic illustration of
implementation of the study. Analyses which were done from the RPEregES
condition besides the RPEbasic condition are marked with asterisks (*).
Analyses were done from floating aggregate cultures unless marked with
gray boxes for adherent culture.
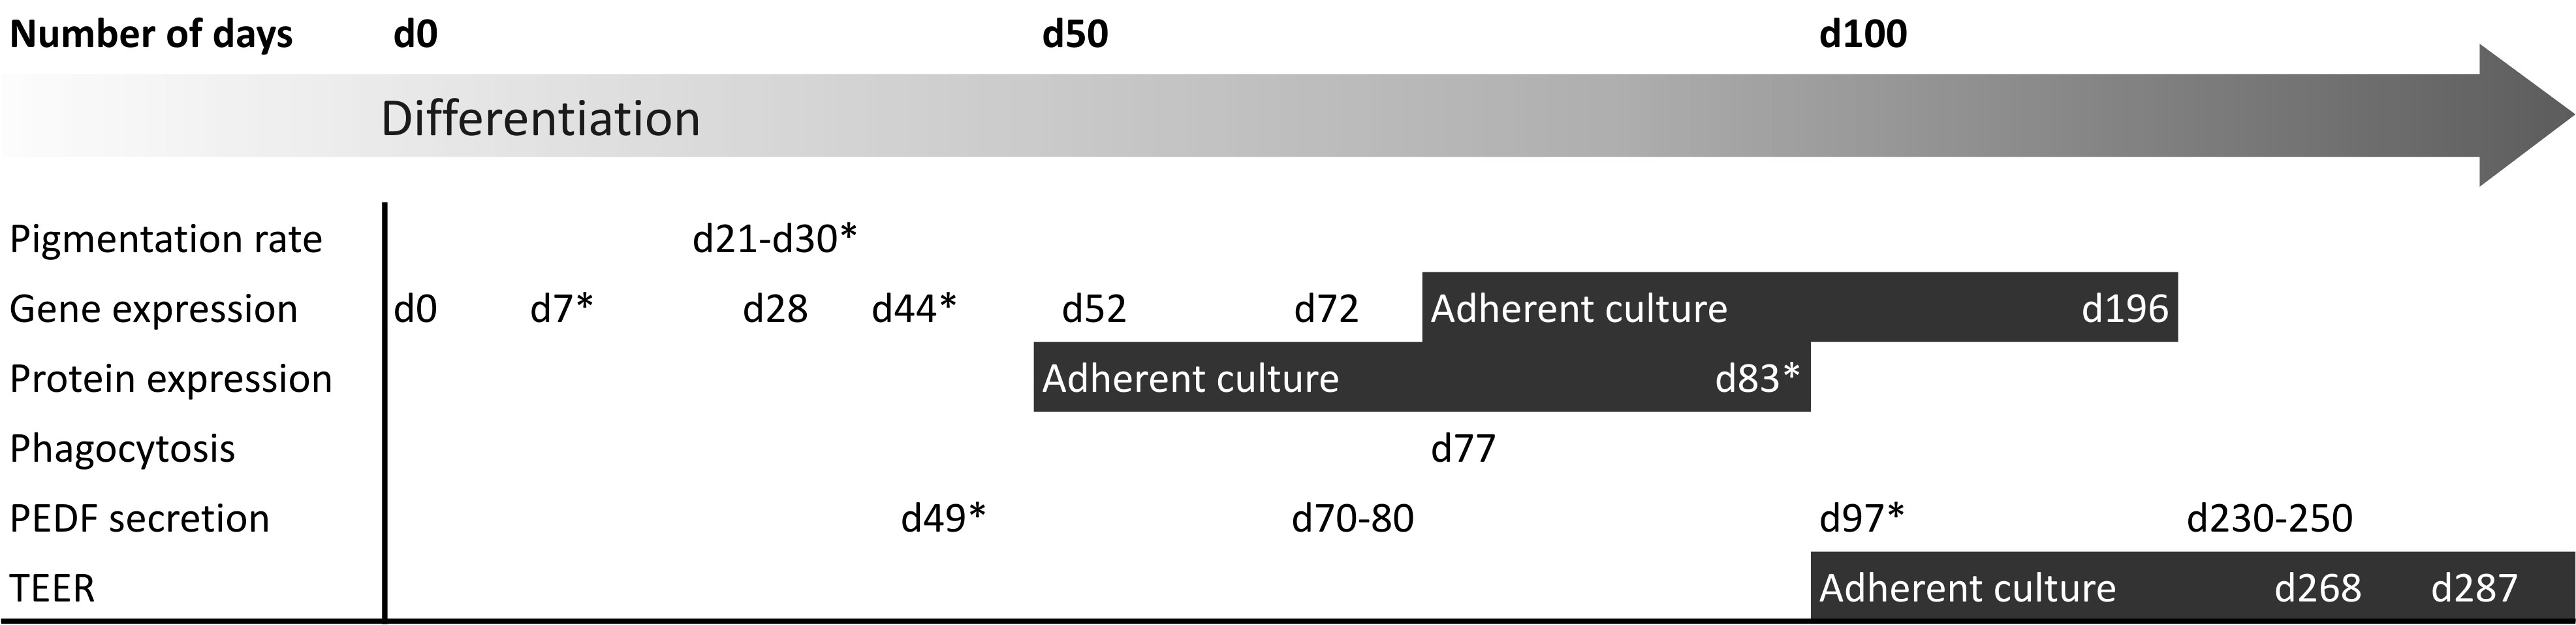
 Figure 2 of Vaajasaari, Mol Vis 2011; 17:558-575.