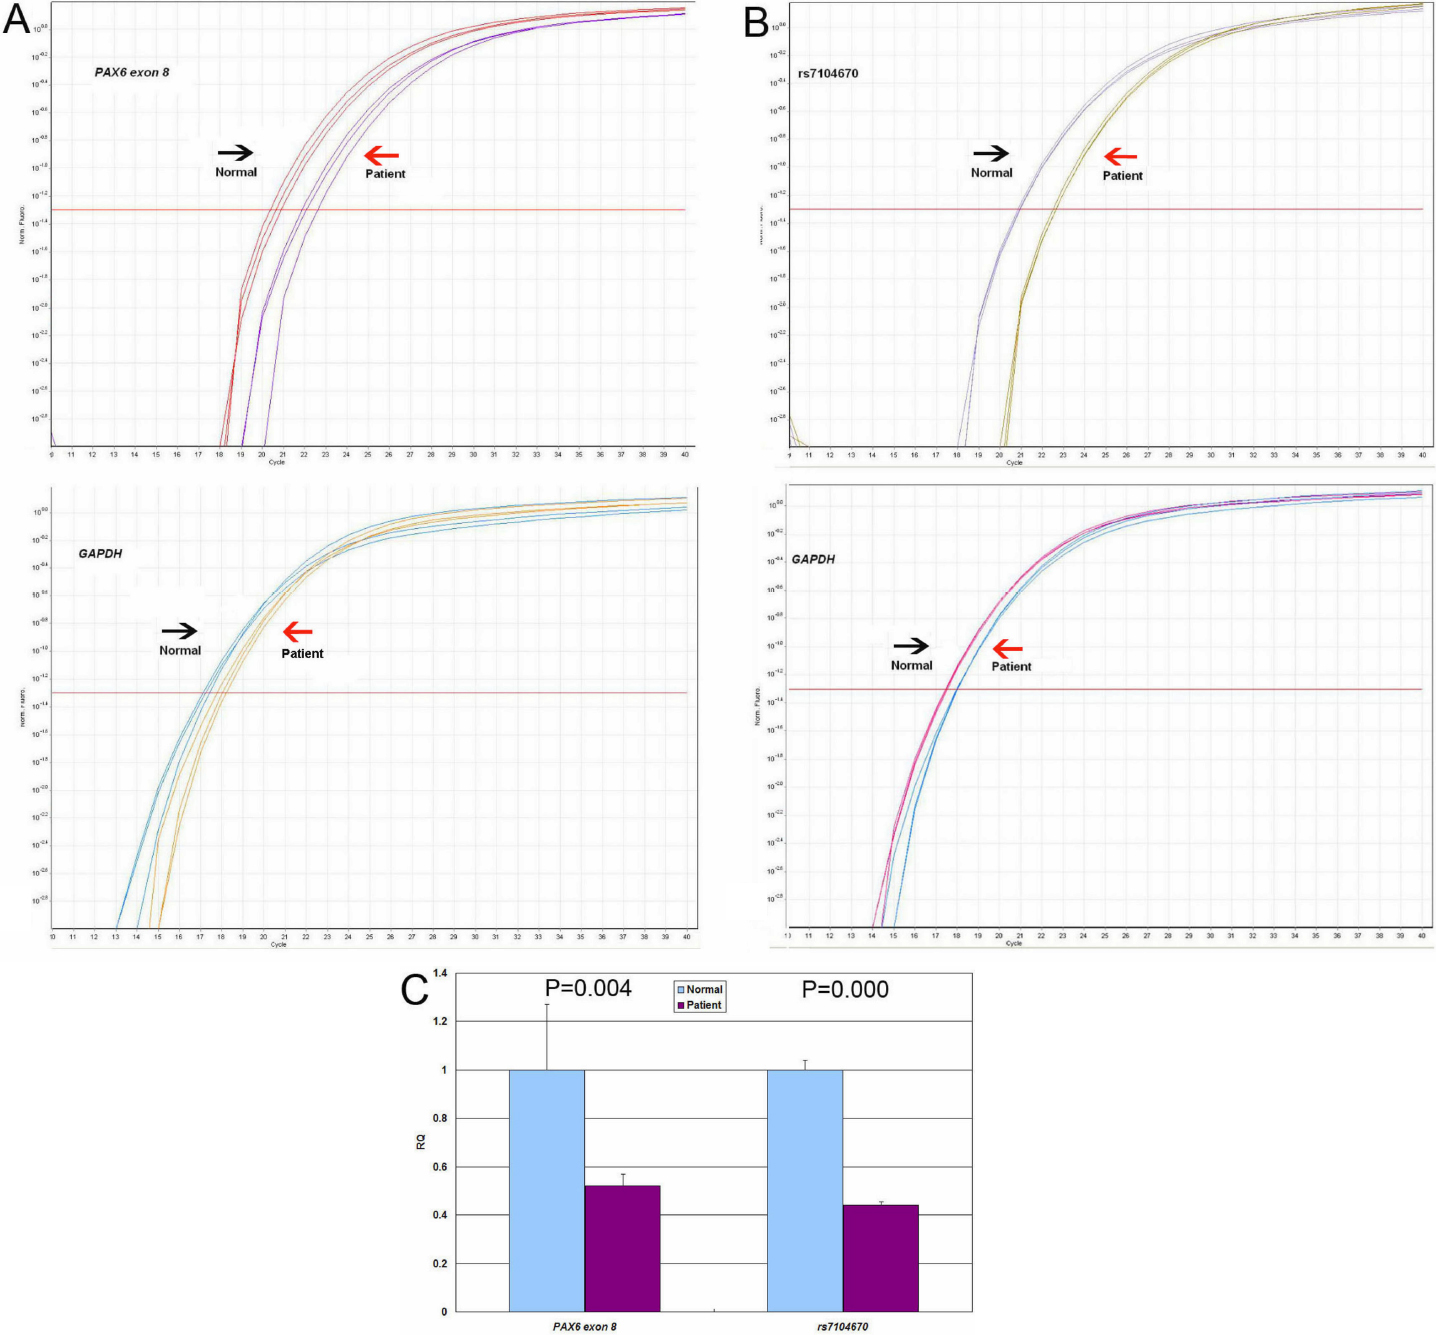
Figure 5. Analysis of deletions in the
PAX6 gene region by real-time quantitative PCR.
A: Fluorescence amplification plots of the real-time quantitative PCR for exon 8 of the
PAX6 gene, detected deletion by MLPA.
B: Fluorescence amplification plots of the real-time PCR for
rs7104670. Arrows in
A and
B indicated triplicate signals obtained for a control subject (Normal) and the patient III-1 of family 85 (Patient).
C: Histogram indicated the relative quantity (RQ) between the exon8 of
PAX6 or
rs7104670 and
GAPDH values. Bars represent mean values±standard deviations for the triplicate values.
 Figure 5 of
Zhang, Mol Vis 2011; 17:548-557.
Figure 5 of
Zhang, Mol Vis 2011; 17:548-557.