Figure 4. The normalized MLPA results of the probands of the two families. A: The normalized MLPA result of III-4 of family 85. B: The result of II-4 of family 86. The height of the columns represents of the dosage of the respective segments in the genomic
DNA with two alleles. The light blue columns represent chromosome 11p13 specific probes. The orange columns represent the
deleted probes. The dark blue columns represent the control probes. The allele dosage of the deleted probes was found in the
range of about 0.5–0.7 of normal control, which corresponds to one allele.
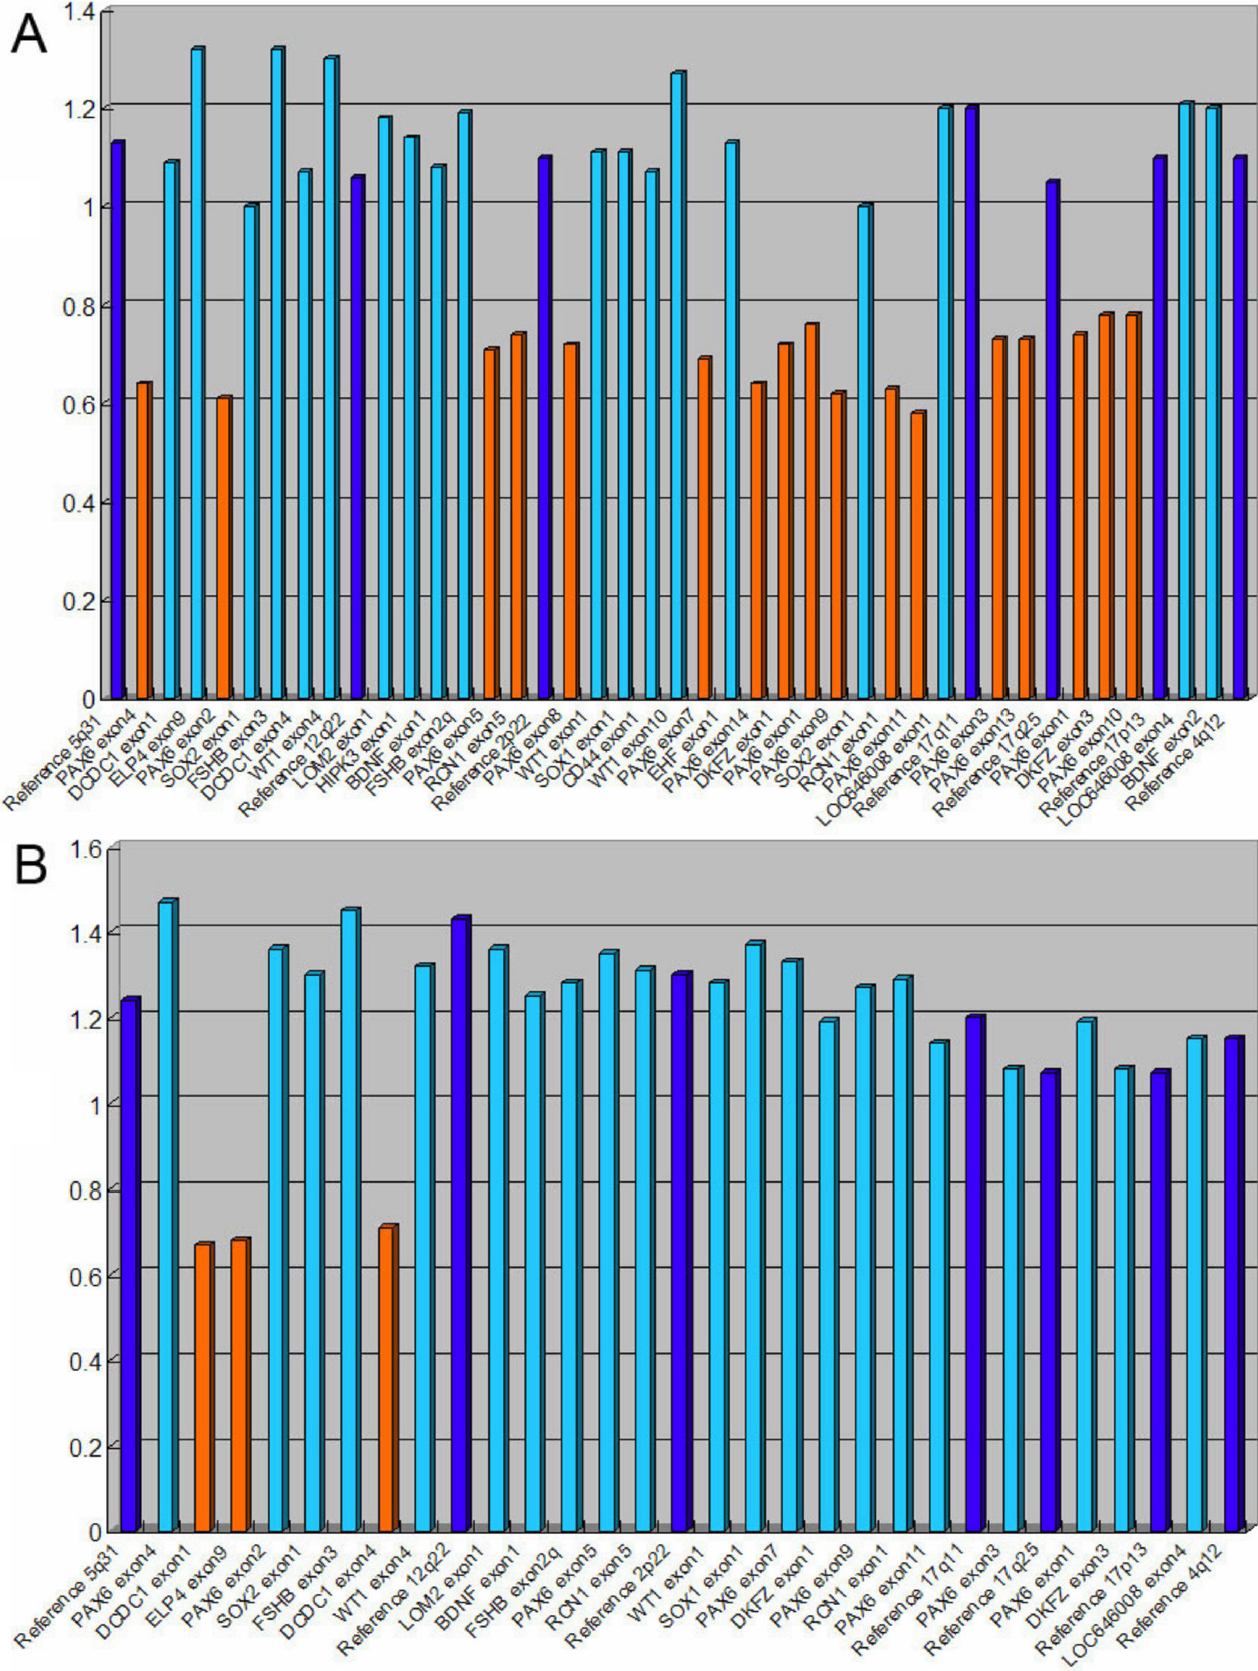
 Figure 4 of
Zhang, Mol Vis 2011; 17:548-557.
Figure 4 of
Zhang, Mol Vis 2011; 17:548-557.