Figure 1. Schematic representation of WT1/ RCN1/ DKFZ p686k1684/PAX6/ ELP4/ DCDC1 on chromosome 11p13 and the relative positions of the microsatellite markers and single nucleotide polymorphism (SNP) used
in linkage and real-time quantitative PCR analysis. D presents DKFZ p686k1684. Brown arrows below the each gene indicated the transcription direction for each gene. The region between the two blue vertical
lines presents the deleted region (407 Kb) of family 85, the region between the two purple vertical lines presents the deleted
region (527 Kb) of family 86.
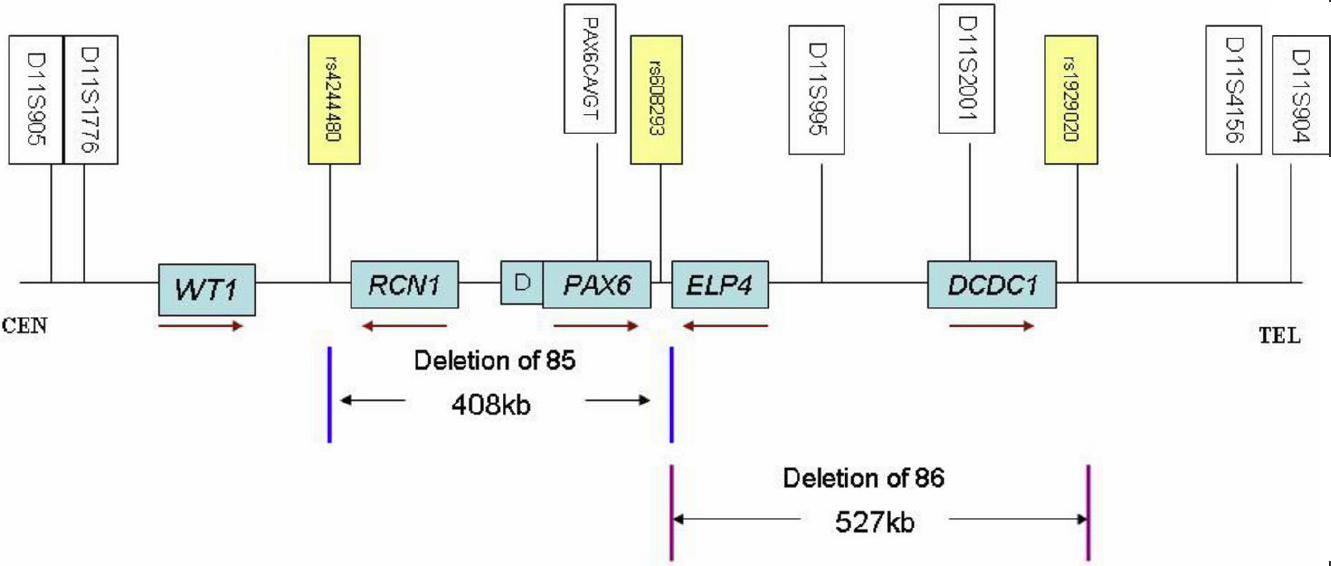
 Figure 1 of
Zhang, Mol Vis 2011; 17:548-557.
Figure 1 of
Zhang, Mol Vis 2011; 17:548-557.