Figure 7. Effect of EGCG on glucose oxidase-induced ROS levels in HCEpiC. Cells were cultured in complete (HCGS-containing) medium,
followed by glucocorticoid-free medium for 18 h. Cells were pretreated with EGCG for 1 h, loaded with CM-H2DCFDA for 30 min, followed by treatment with 50 mU/ml glucose oxidase and EGCG for 1 h. White bar represents control; black
bar represents glucose oxidase (GO) alone; black circles indicate glucose oxidase and EGCG. n=4, *versus GO, p<0.05.
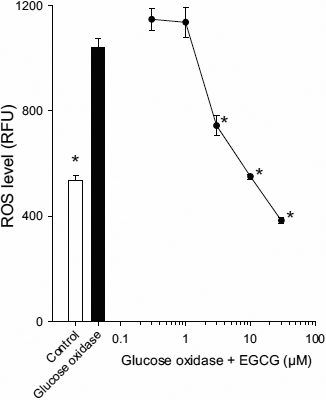
 Figure 7 of
Cavet, Mol Vis 2011; 17:533-542.
Figure 7 of
Cavet, Mol Vis 2011; 17:533-542.