Figure 2. EGCG inhibits hyperosmolar-induced cytokine release in HCEpiC. Cells were cultured in complete (HCGS-containing) medium, followed
by glucocorticoid-free medium for 18 h. Cells were then treated with 440 mOsm hyperosmotic basal media in the presence of
EGCG for 24 h. IL-6 (A) and MCP-1 (B) release into the media was analyzed by Luminex. White bar represents control (317 mOsm); black bar represents hyperosmolarity
(440 mOsm); gray bar represents EGCG alone; black circles + line represents EGCG. Lines are the linear interpolation between
data points. Data are presented as mean±SEM, n=3. *versus 440 mOsm hyperosmotic media; p<0.05.
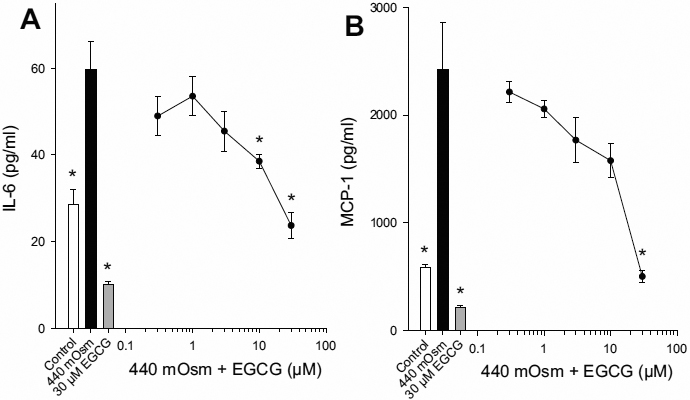
 Figure 2 of
Cavet, Mol Vis 2011; 17:533-542.
Figure 2 of
Cavet, Mol Vis 2011; 17:533-542.