Figure 3 of
Udar, Mol Vis 2011; 17:519-525.
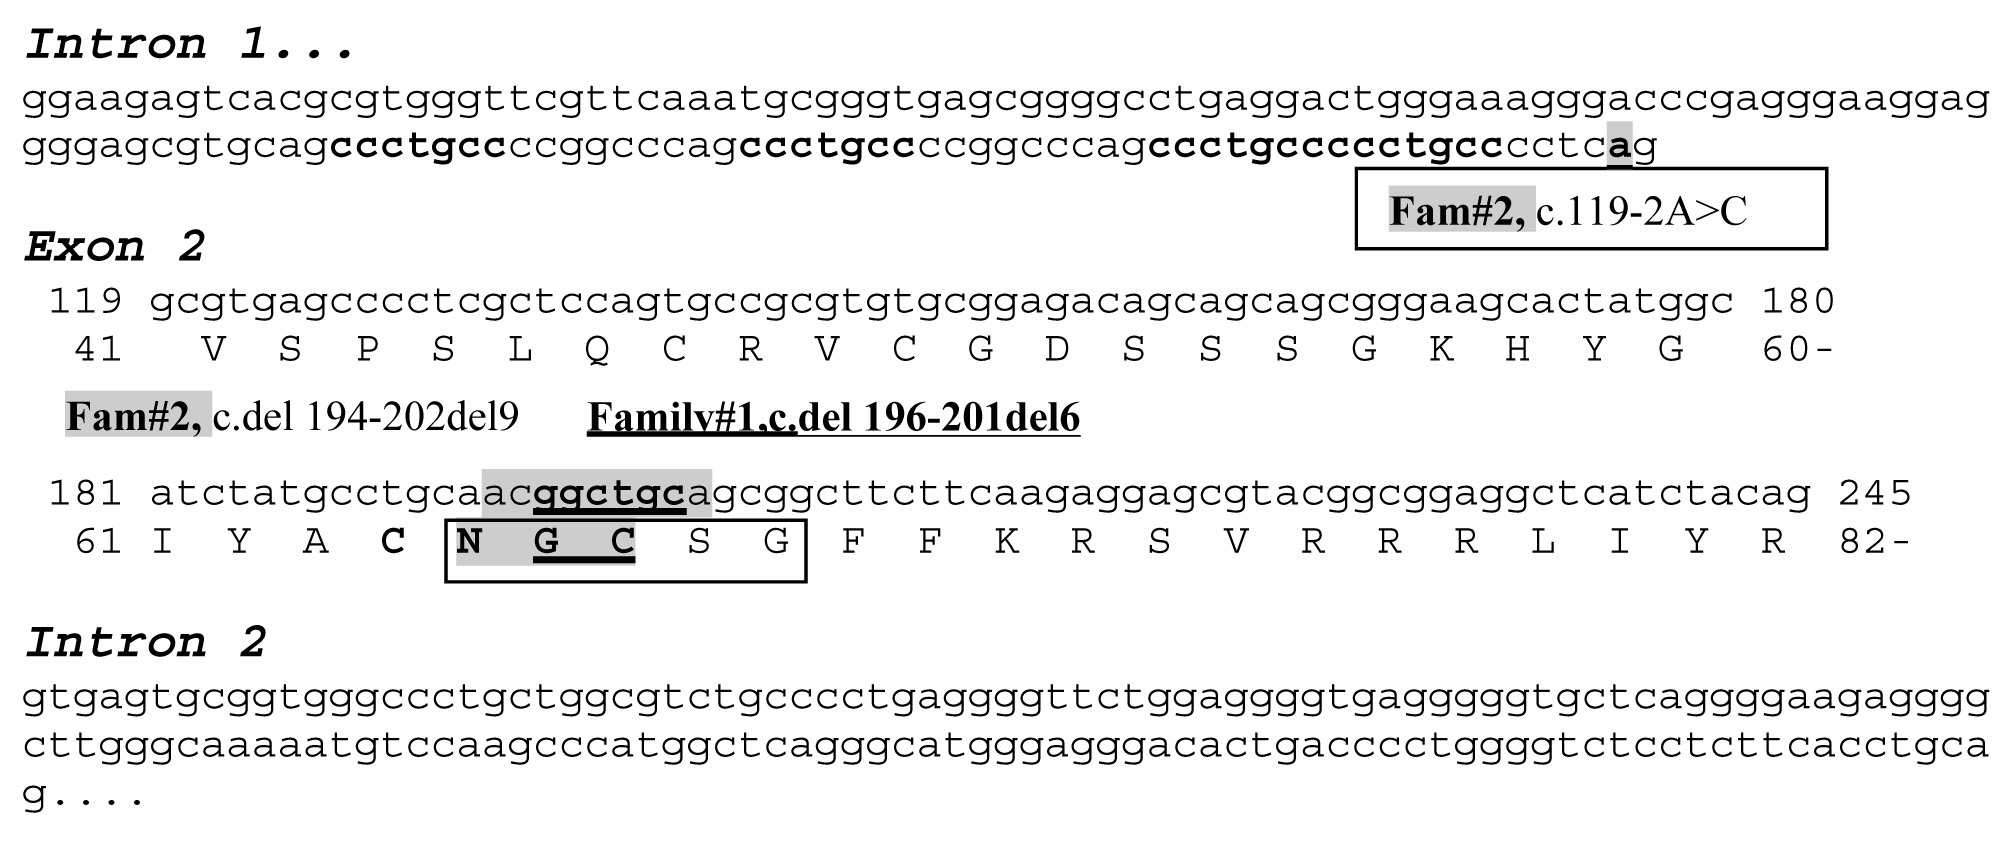
Figure 3.
Sequence of intron 1 and exon 2 of
NR2E3
showing the mutations of Case 1 and 2. Repeat sequences are given in bold. The novel mutations of Case 1 are underlined. The mutations of Case 2 are shaded. A square box defines the P-box.
 Figure 3 of Udar, Mol Vis 2011; 17:519-525.