Figure 1. Electroretinograms comparing
normal tracings to Case 1 and Case 2. Case 1 shows electroretinogram
(ERG) amplitudes similar to the normal dark-adapted combined rod-cone
response under both scotopic and photopic conditions (Scale bars show
amplitude 500 microvolts, duration 75 ms). The responses from Case 2
have similar waveform, and scotopic-photopic homology, but lower
amplitude.
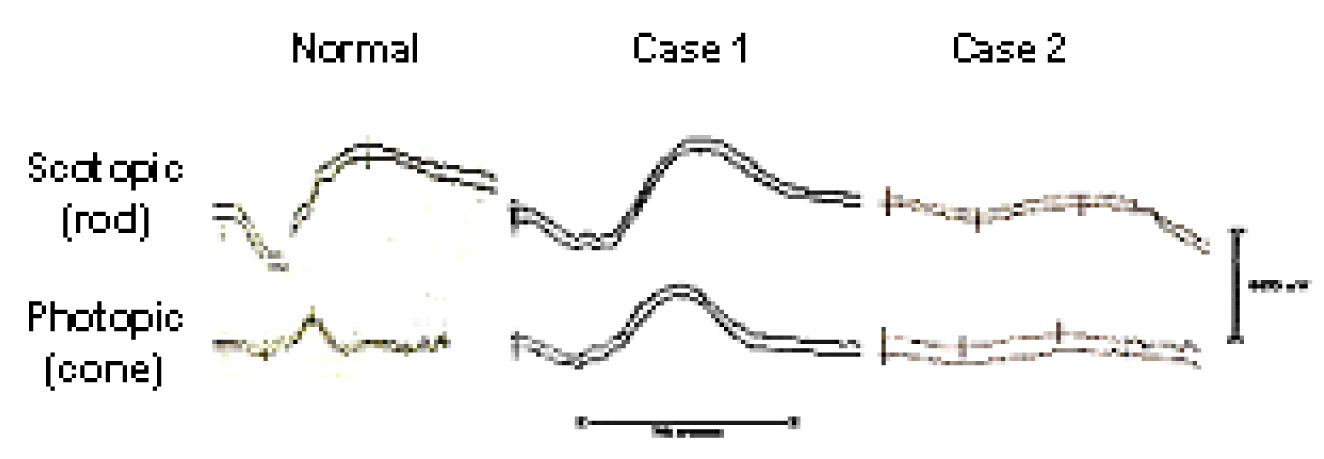
 Figure 1 of Udar, Mol Vis 2011; 17:519-525.