Figure 2 of
Chen, Mol Vis 2011; 17:486-491.
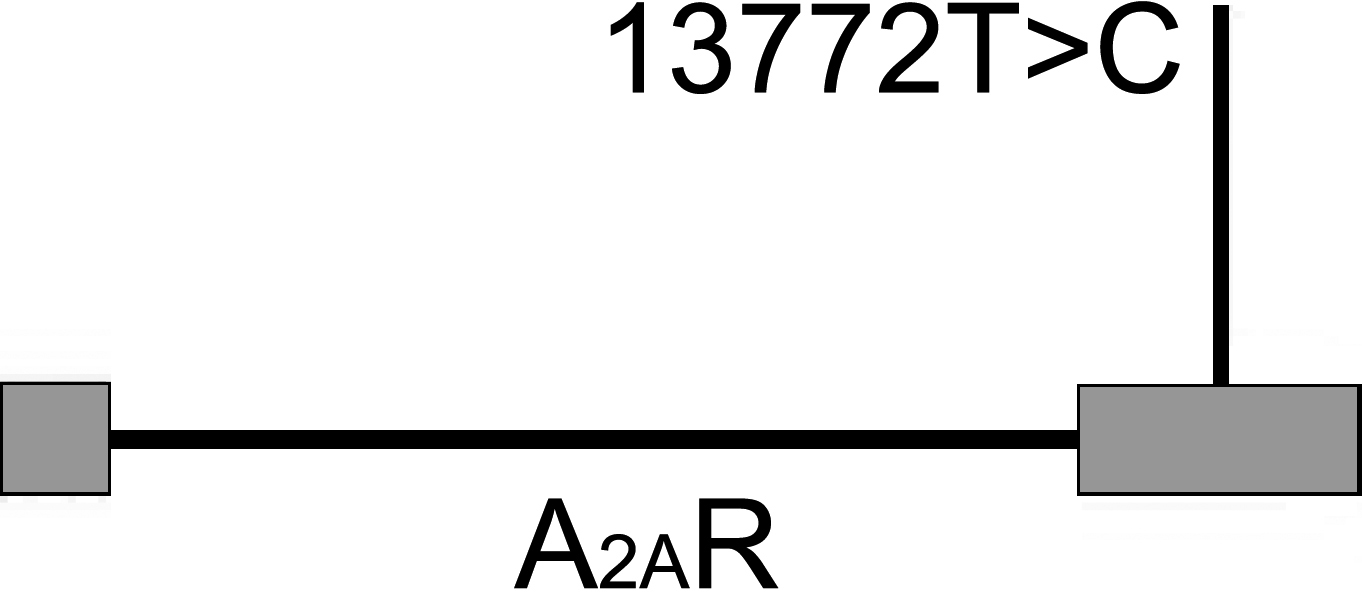
Figure 2.
Schematic diagram of the single nucleotide polymorphism
rs5751876
within
A
2A
R
. The gray rectangles represent exons, and the lines represent introns.
 Figure 2 of
Chen, Mol Vis 2011; 17:486-491.
Figure 2 of
Chen, Mol Vis 2011; 17:486-491.