Figure 2 of
Paliwal, Mol Vis 2011; 17:481-485.
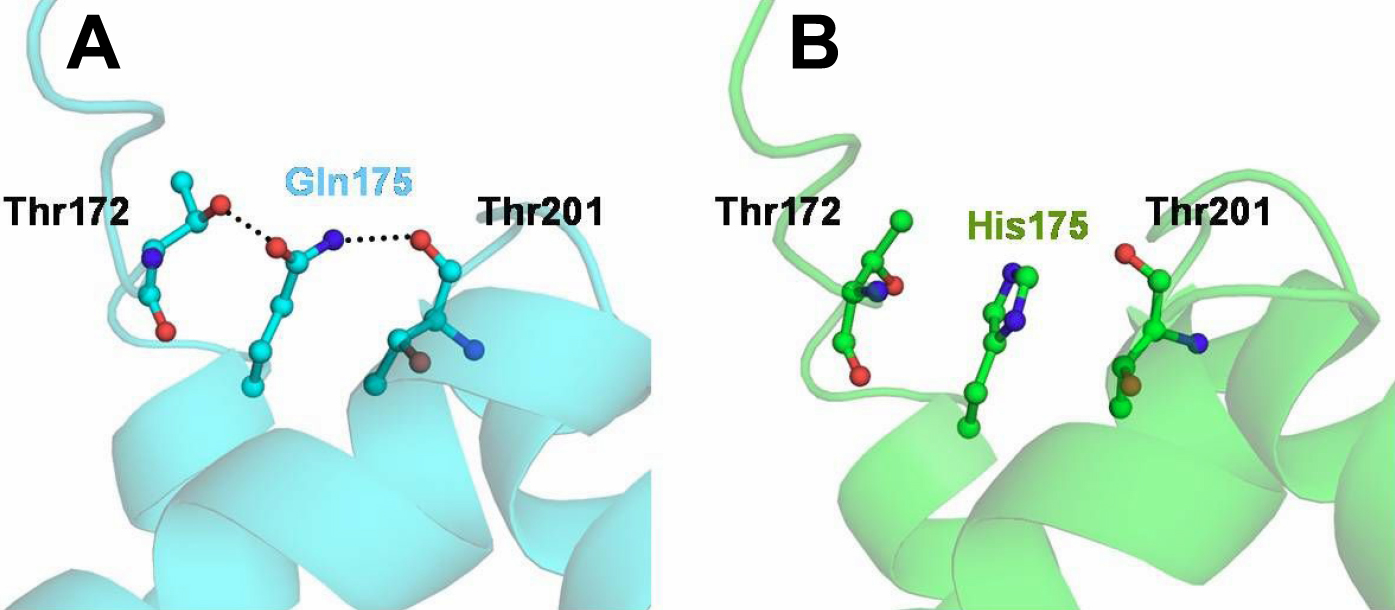
Figure 2.
Close view of the VSX1 Q175H mutation area. The hydrogen bond interactions are marked for clarity in the wild type (
A
, cyan) and their disruption in the mutant (
B
, green) proteins.
 Figure 2 of
Paliwal, Mol Vis 2011; 17:481-485.
Figure 2 of
Paliwal, Mol Vis 2011; 17:481-485.