Figure 8. Evaluation of biocompatibility
of passage 101 HCE cells on dAMs. A: The confluent cell sheet
formed by HCE cells on dAM 116 h after inoculation. The cell density
and elongated polygonal morphology were shown. Scale bar: 25 μm. B:
alizarin
red staining pattern of the HCE cell sheet. The cell density,
elongated polygonal morphology and established intercellular junctions
were shown. Scale bar: 25 μm. C: SEM image of the HCE cell
sheet. The confluent cell sheet and elongated polygonal morphology of
HCE cells were shown. Scale bar: 25 μm. D: hematoxylin-eosin
(HE) staining pattern of the frozen section of the HCE cell sheet. The
confluent monolayer cell sheet formed by HCE cells on dAM was shown.
Scale bar: 100 μm. E: TEM image of the HCE cell sheet. The
tightly attaching status of the cell sheet and dAM was shown. Scale
bar: 4 μm. F: TEM image of the HCE cell sheet. The
ultrastructure of HCE cells, the established cell-cell junctions (arrow
heads) and cell-dAM junctions (asterisk) were shown. Scale bar: 500 nm.
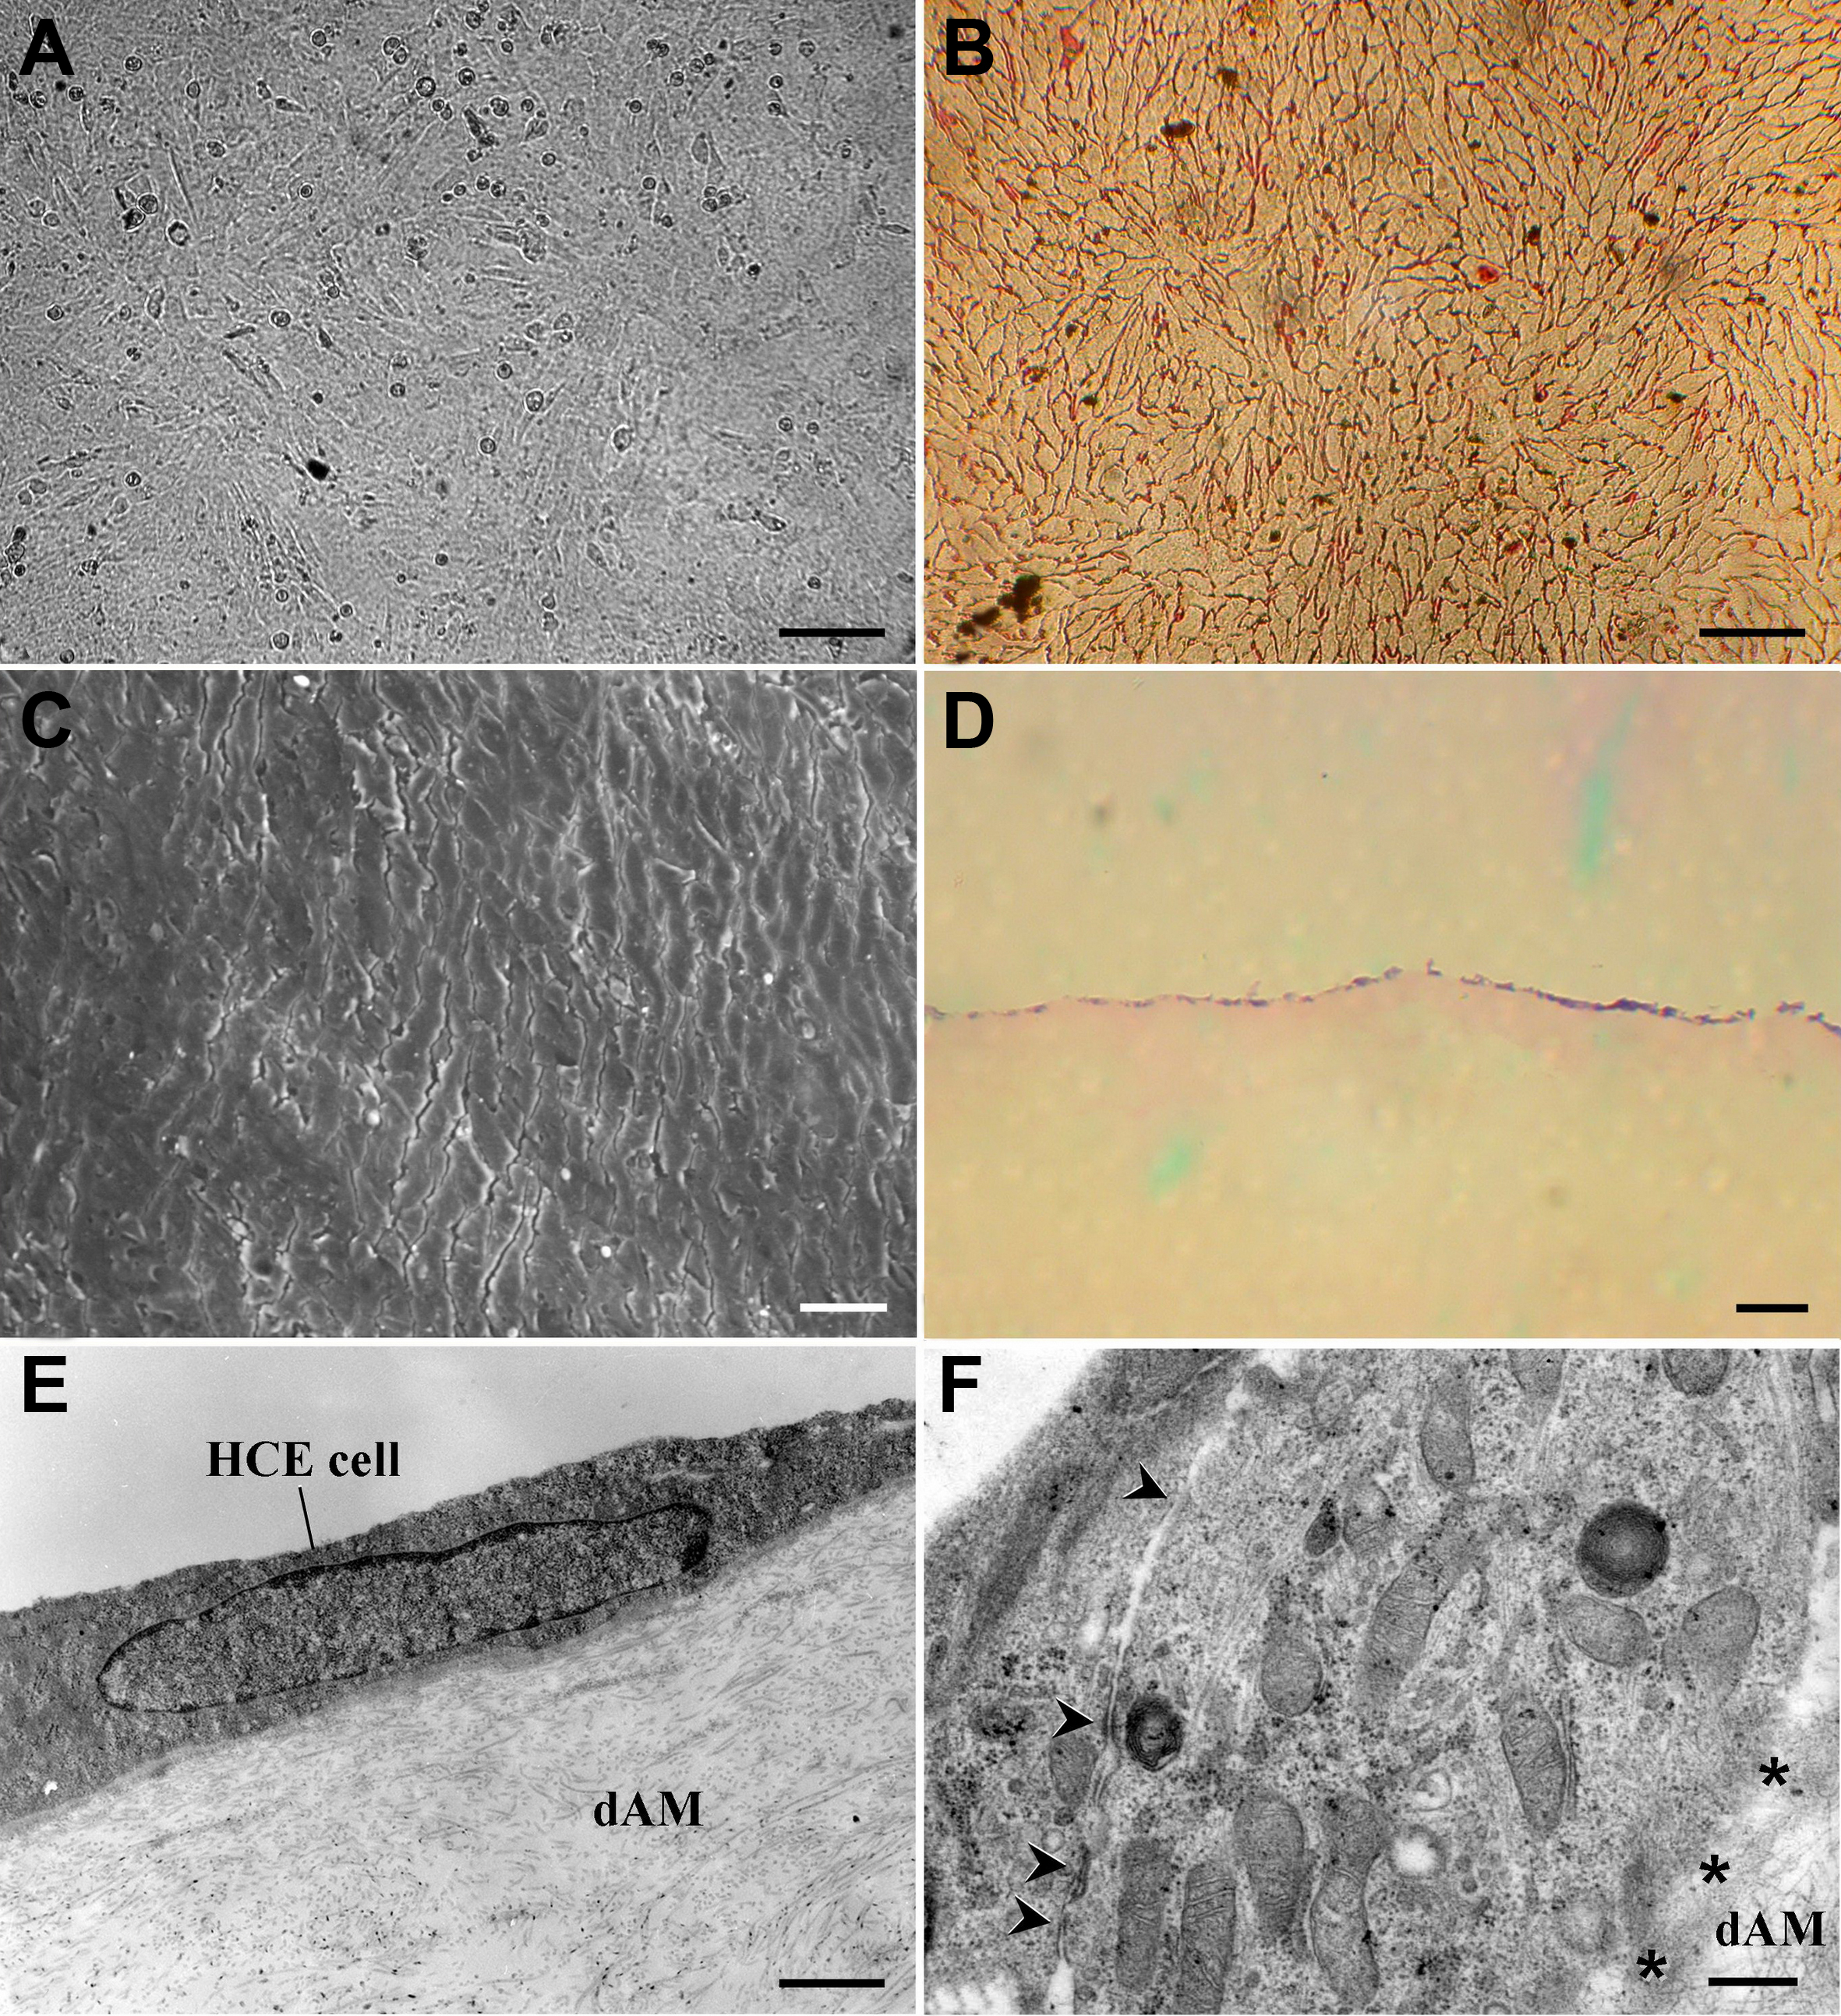
 Figure 8 of Fan, Mol Vis 2011; 17:469-480.