Figure 2 of
Fan, Mol Vis 2011; 17:469-480.
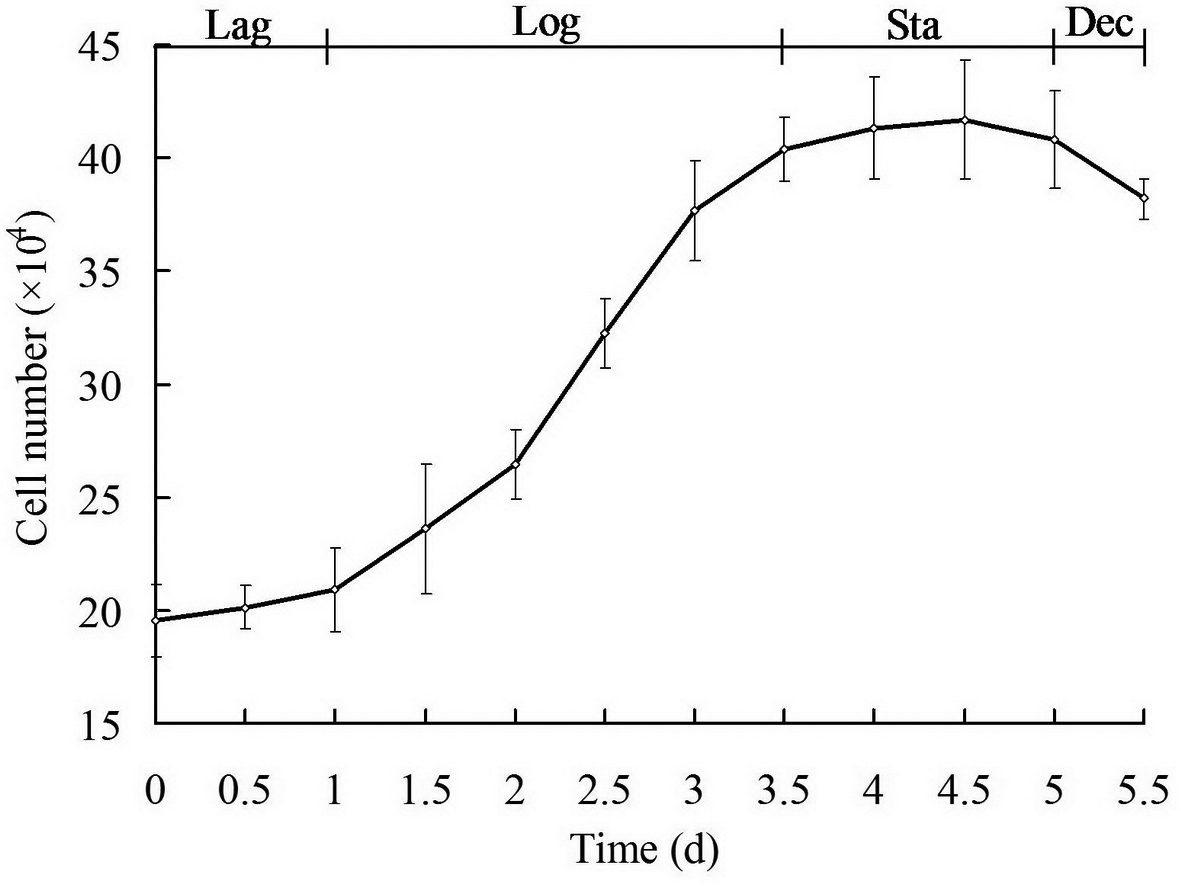
Figure 2.
The growth curve of HCE cells at passage 101. The cells had a population doubling time of 26.20 h. The results represent means±SD (n=3). Lag, lag phase; Log, exponential or logarithmic phase; Sta, stationary phase; Dec, decline phase.
 Figure 2 of
Fan, Mol Vis 2011; 17:469-480.
Figure 2 of
Fan, Mol Vis 2011; 17:469-480.