Figure 6. The 3D model and the anolea mean force potential plot for the target protein of human FRMD7. A: The model rendered in 3-D for the target human FRMD7 protein. α-helices, coils, and β-sheets are depicted in red, gray,
and green, respectively. Only two amino acids, H208 and M209, are located inside the region between the two β-sheets (denoted
by an arrow). B: The anolea mean force potential plot for the target protein of the human FRMD7. Above is the mutant type of the FRMD7 protein;
below is the wild type of the FRMD7 protein. The y-axis of the plot represents the energy for each amino acid of the protein
chain. Negative energy values (in green) represent a favorable energy environment, whereas positive values (in red) indicate
an unfavorable energy environment for a given amino acid. A favorable energy environment tends to be damaged because of an
H to R change at codon208.
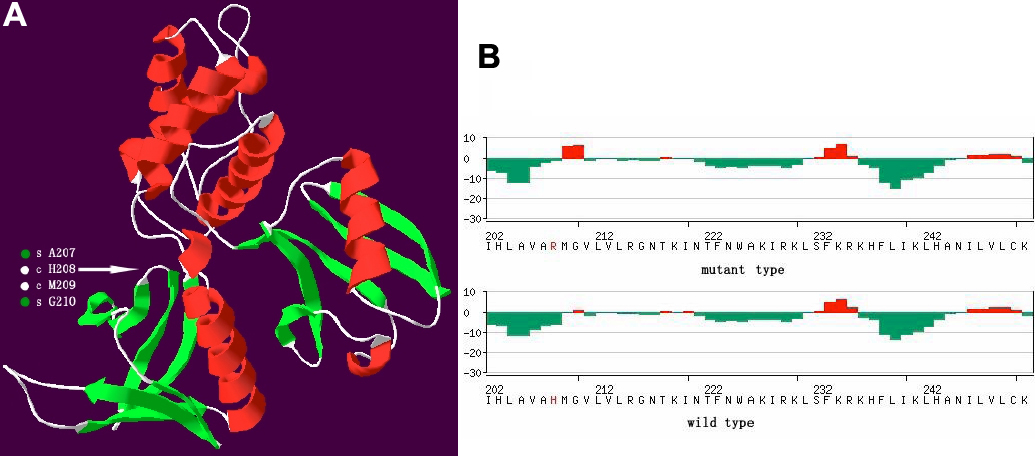
 Figure 6 of
Li, Mol Vis 2011; 17:461-468.
Figure 6 of
Li, Mol Vis 2011; 17:461-468.