Figure 1. Mutation analysis. The left and
right panels relate to c.252insC and c.826G>A (p.E276K) mutations,
respectively. Upper, middle and left lower panels are electropherograms
of patients, unaffected controls, and one of the parents, respectively.
Each identified mutation is indicated by an arrow. Right lower panel
showing RFLP analysis for the c.826G>A mutation in patient 2. MboII
digested the wild-type allele of a control into 247 and 201-bp
products. The c.826G>A creates another cleavage site for MboII
resulting in 169 and 32-bp bands. Note that the 32-bp band is not
visualized. (M=100-bp marker, P=patient, C=control, U=uncut amplified
product). The 500-bp band is indicated by an arrowhead.
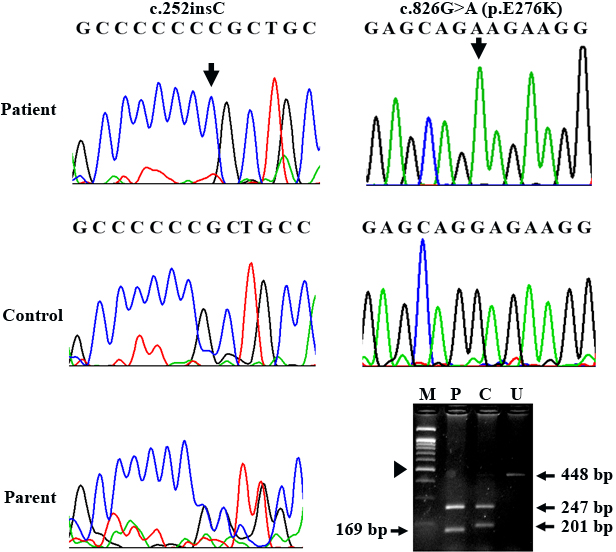
 Figure 1 of Prommajan, Mol Vis 2011; 17:456-460.