Figure 3 of
Cheng, Mol Vis 2011; 17:448-455.
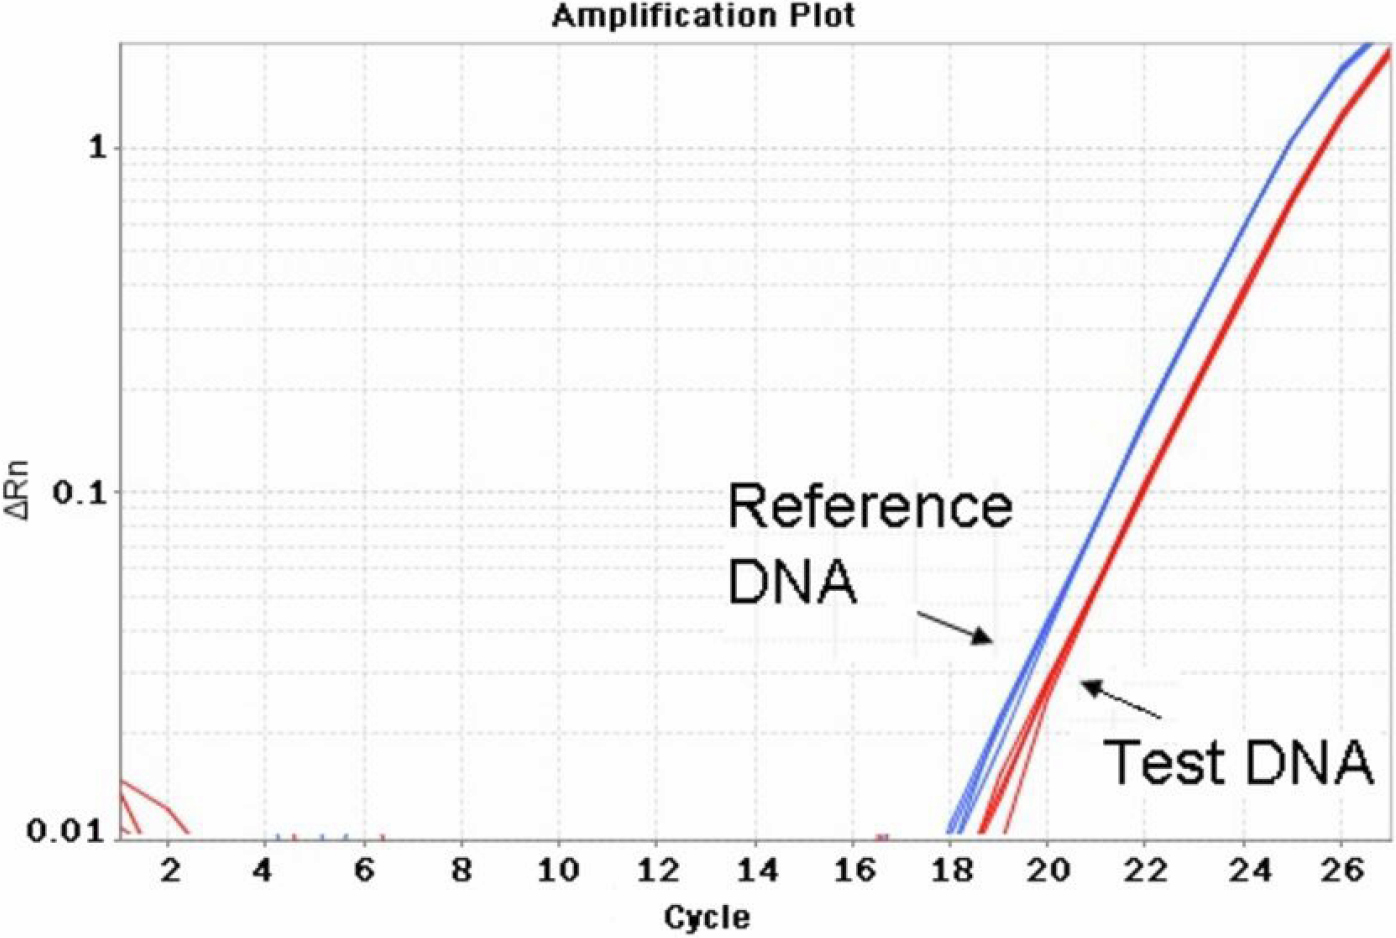
Figure 3.
qPCR analysis result. An example of the qPCR amplification plot showed a single copy of the test gene,
ELP4
, in the affected individuals compared to the two copies of this gene in the reference DNA.
 Figure 3 of Cheng, Mol Vis 2011; 17:448-455.