Figure 1. Diagram of the FOXL2
gene and positions of the amplification segments by the q-real-time PCR
primers in FOXL2. Shaded areas represent the DNA-binding domain
and the polyalanine tract in the coding region of FOXL2,
respectively. Black boxes indicate the location of the amplification
segments of two pairs of primers with respect to the nucleotide (top)
numbering.
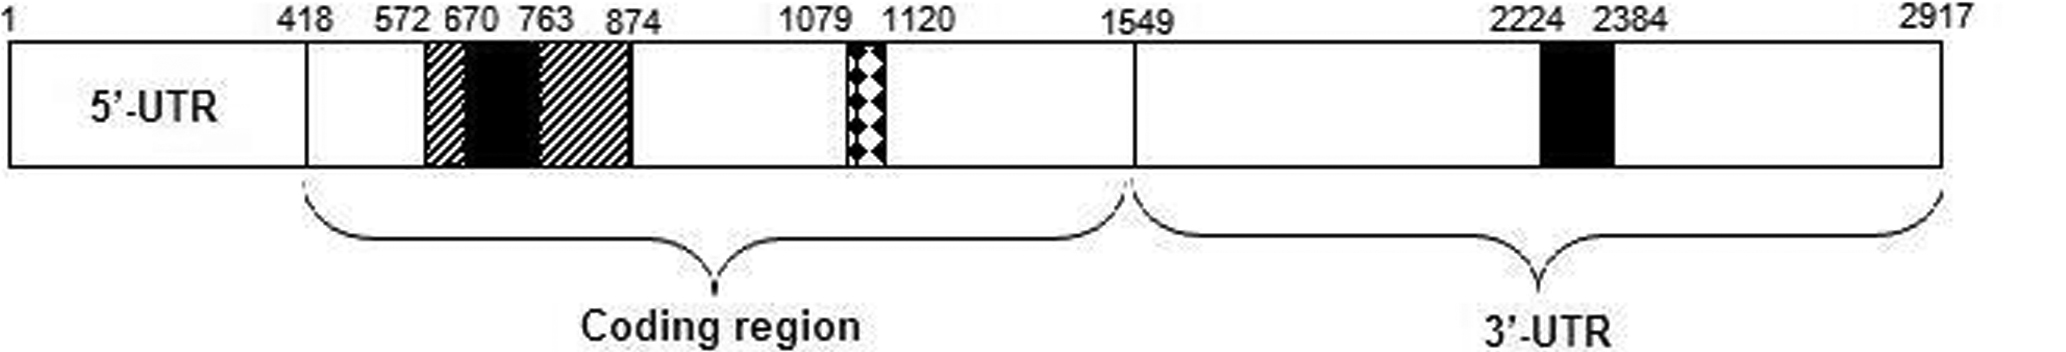
 Figure 1 of Hu, Mol Vis 2011; 17:436-442.