Figure 4. Flow cytometric analysis of
graft-infiltrating lymphocyte populations. A, B:
Allo-grafted cornea analyzed at day 7 post-op. A:
Forward-sideward scatter morphology of graft infiltrating cells. B:
Representative
image of CD161dull expression on LGL. No
other cell type could be detected. Recorded events: 2–5×10³.
C-H: FACS results of allo-rejecting corneas: Events
acquired: 5×10³ to 3×10⁴ per sample. C:
FSC-SSC morphology of GIL. D: Detection of T-lymphocytes. E:
Measurement
of CD8 and CD161 NK markers on GIL. F:
Sub-characterization of CD4+ T-cells and MHC-2 detection. G:
Expression pattern of CD3 from populations gated in E. H:
Measurement
of CD25 T-cell activation markers on populations gated in D.
Cut-off or positive CD25 expression was determined by measuring isotype
FMO samples on lymphocytes in draining LN from the same animal. For
scaling reasons data are not shown in histogram. Bar diagram: Summary
of all lymphocyte specimens identified in rejected corneas (left
diagram) and appropriate sub-characterizations (right diagram) n=5.
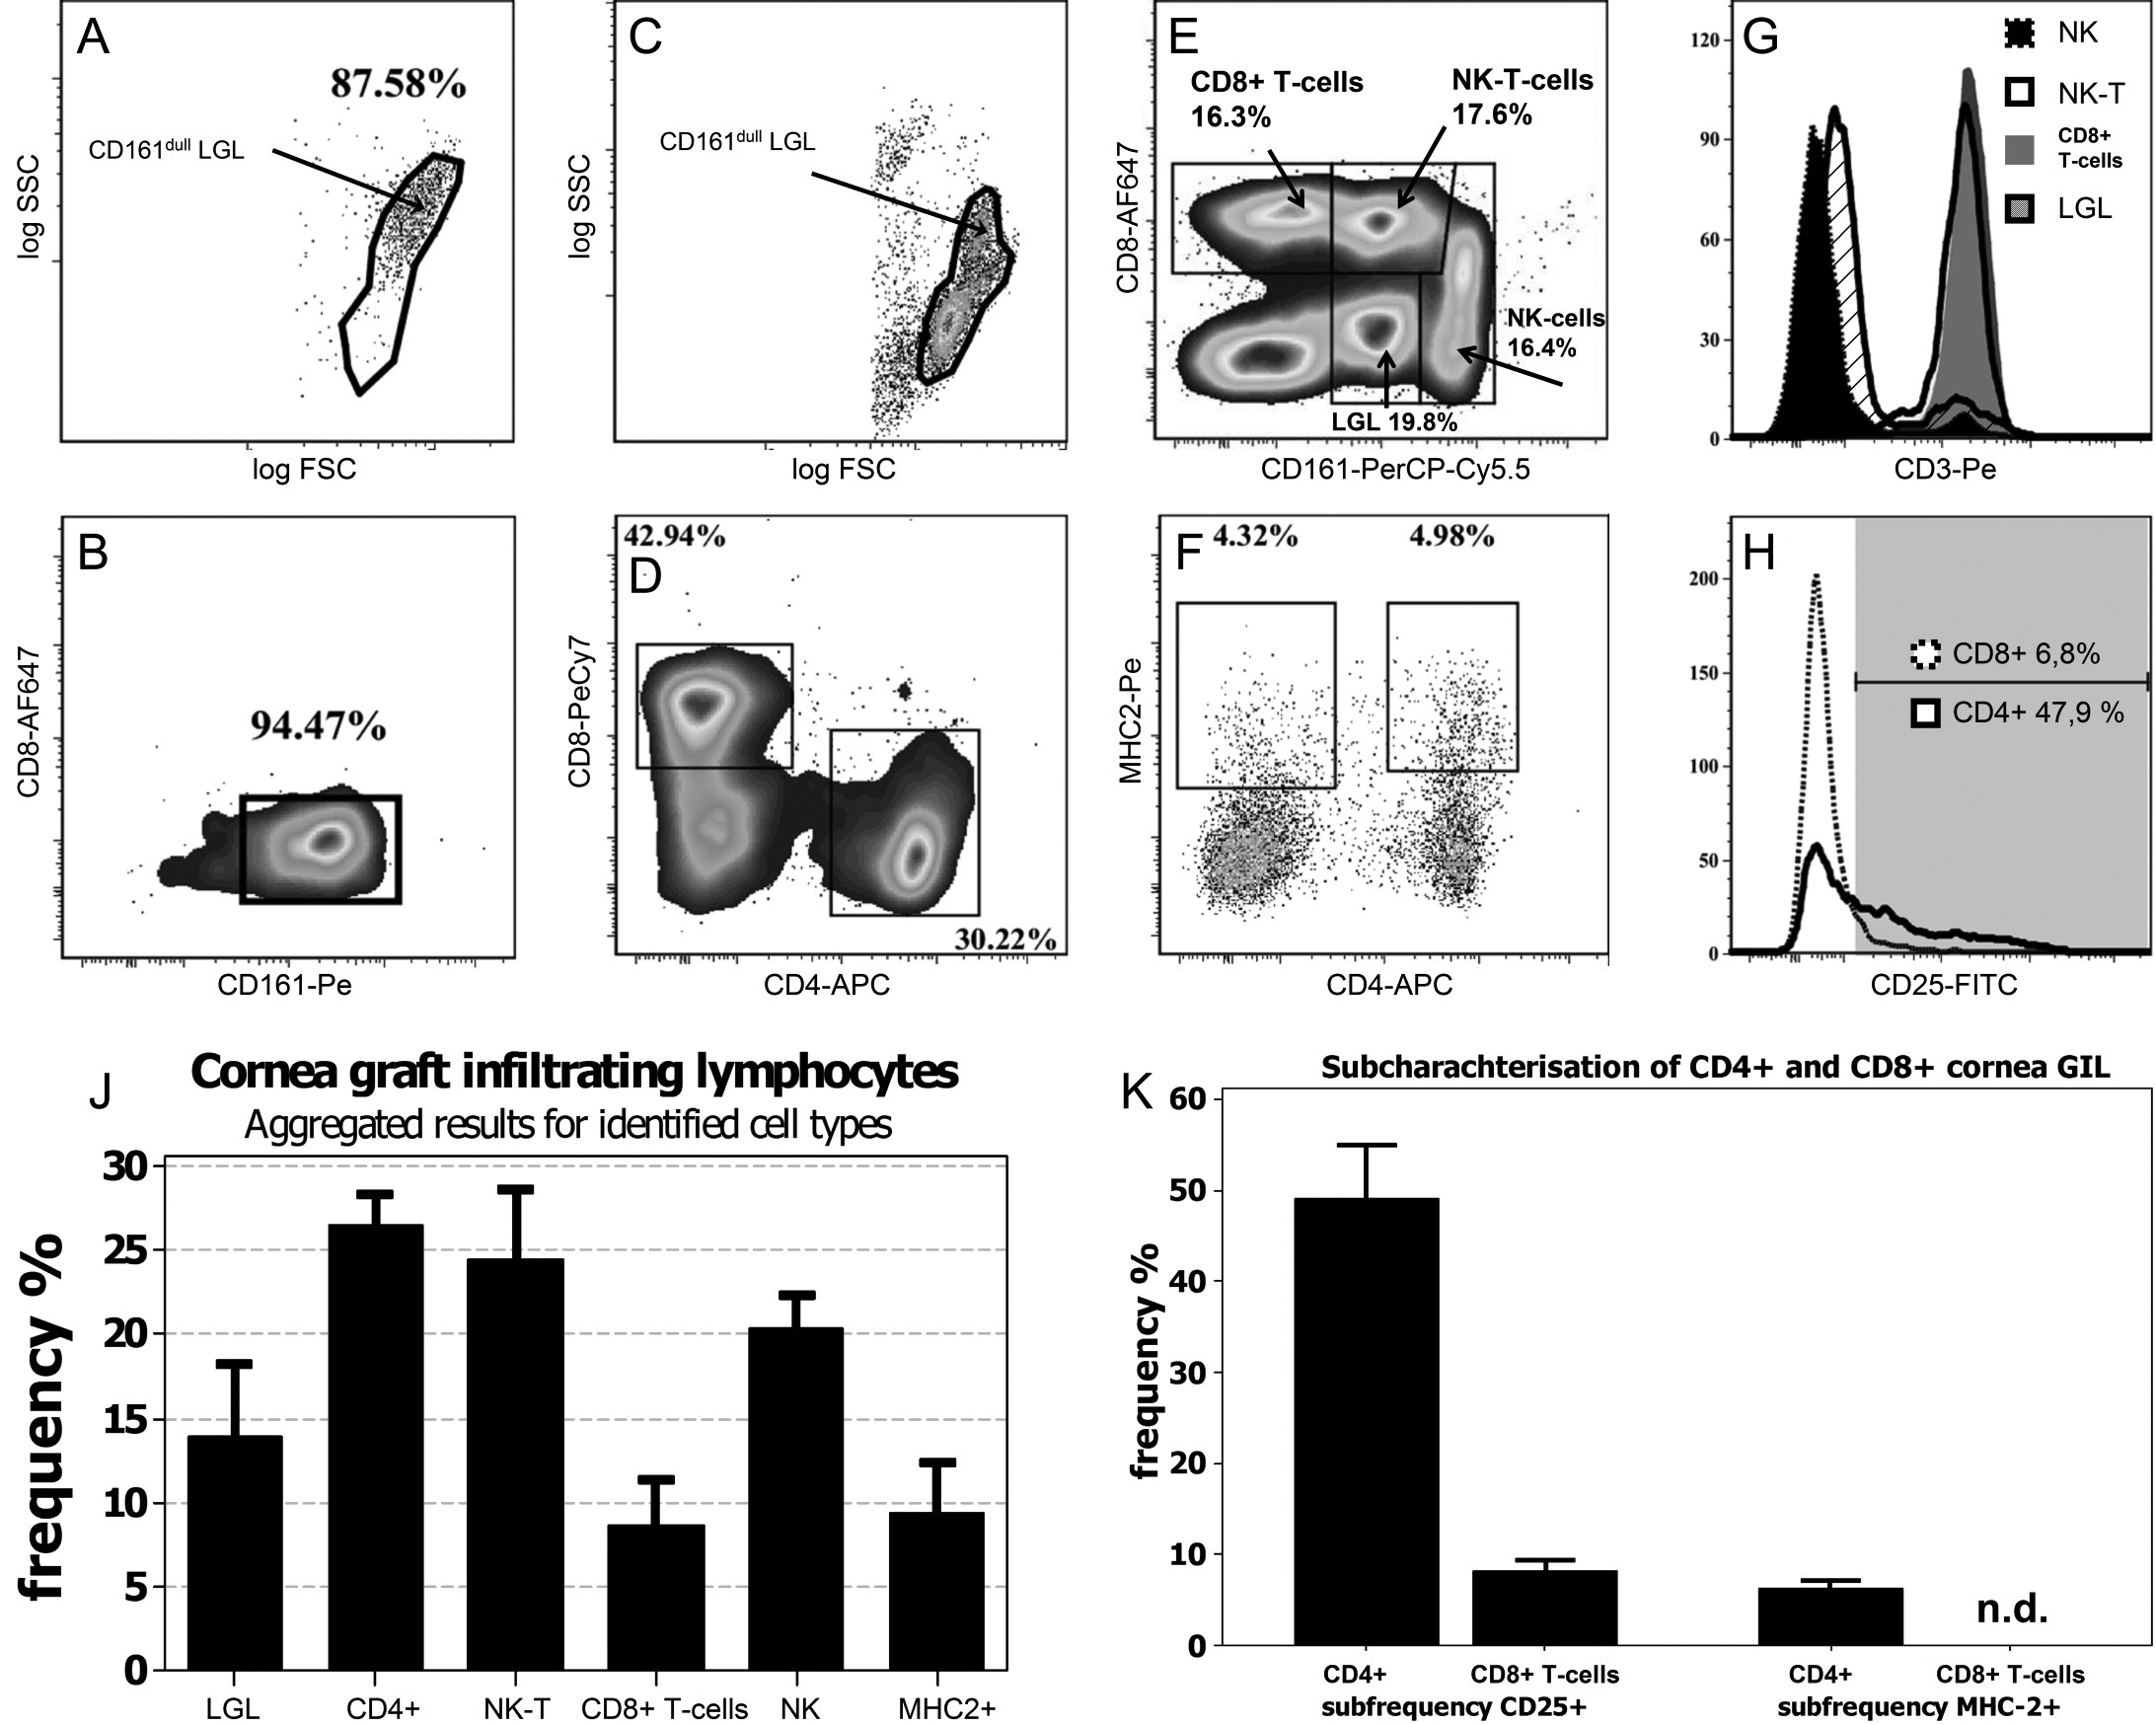
 Figure 4 of Maenz, Mol Vis 2011; 17:420-429.