Figure 3. Flow cytometric analysis of
helper T-cell activation markers in draining lymph nodes. A:
Representative FACS plot of activation marker expression on CD4+ single
positive T-helper cell in draining LN. Events acquired: 2×10⁵.
B: Example of CD25 and CD134 expression pattern on CD4+CD8+
double positive T-cells. Bar diagrams: Cumulative results for the
quantification of T-cell activation status of Helper T-lymphocytes. An
asterisk (*) indicates statistical significance at p≤0.05 determined by
Mann–Whitney U-Test.
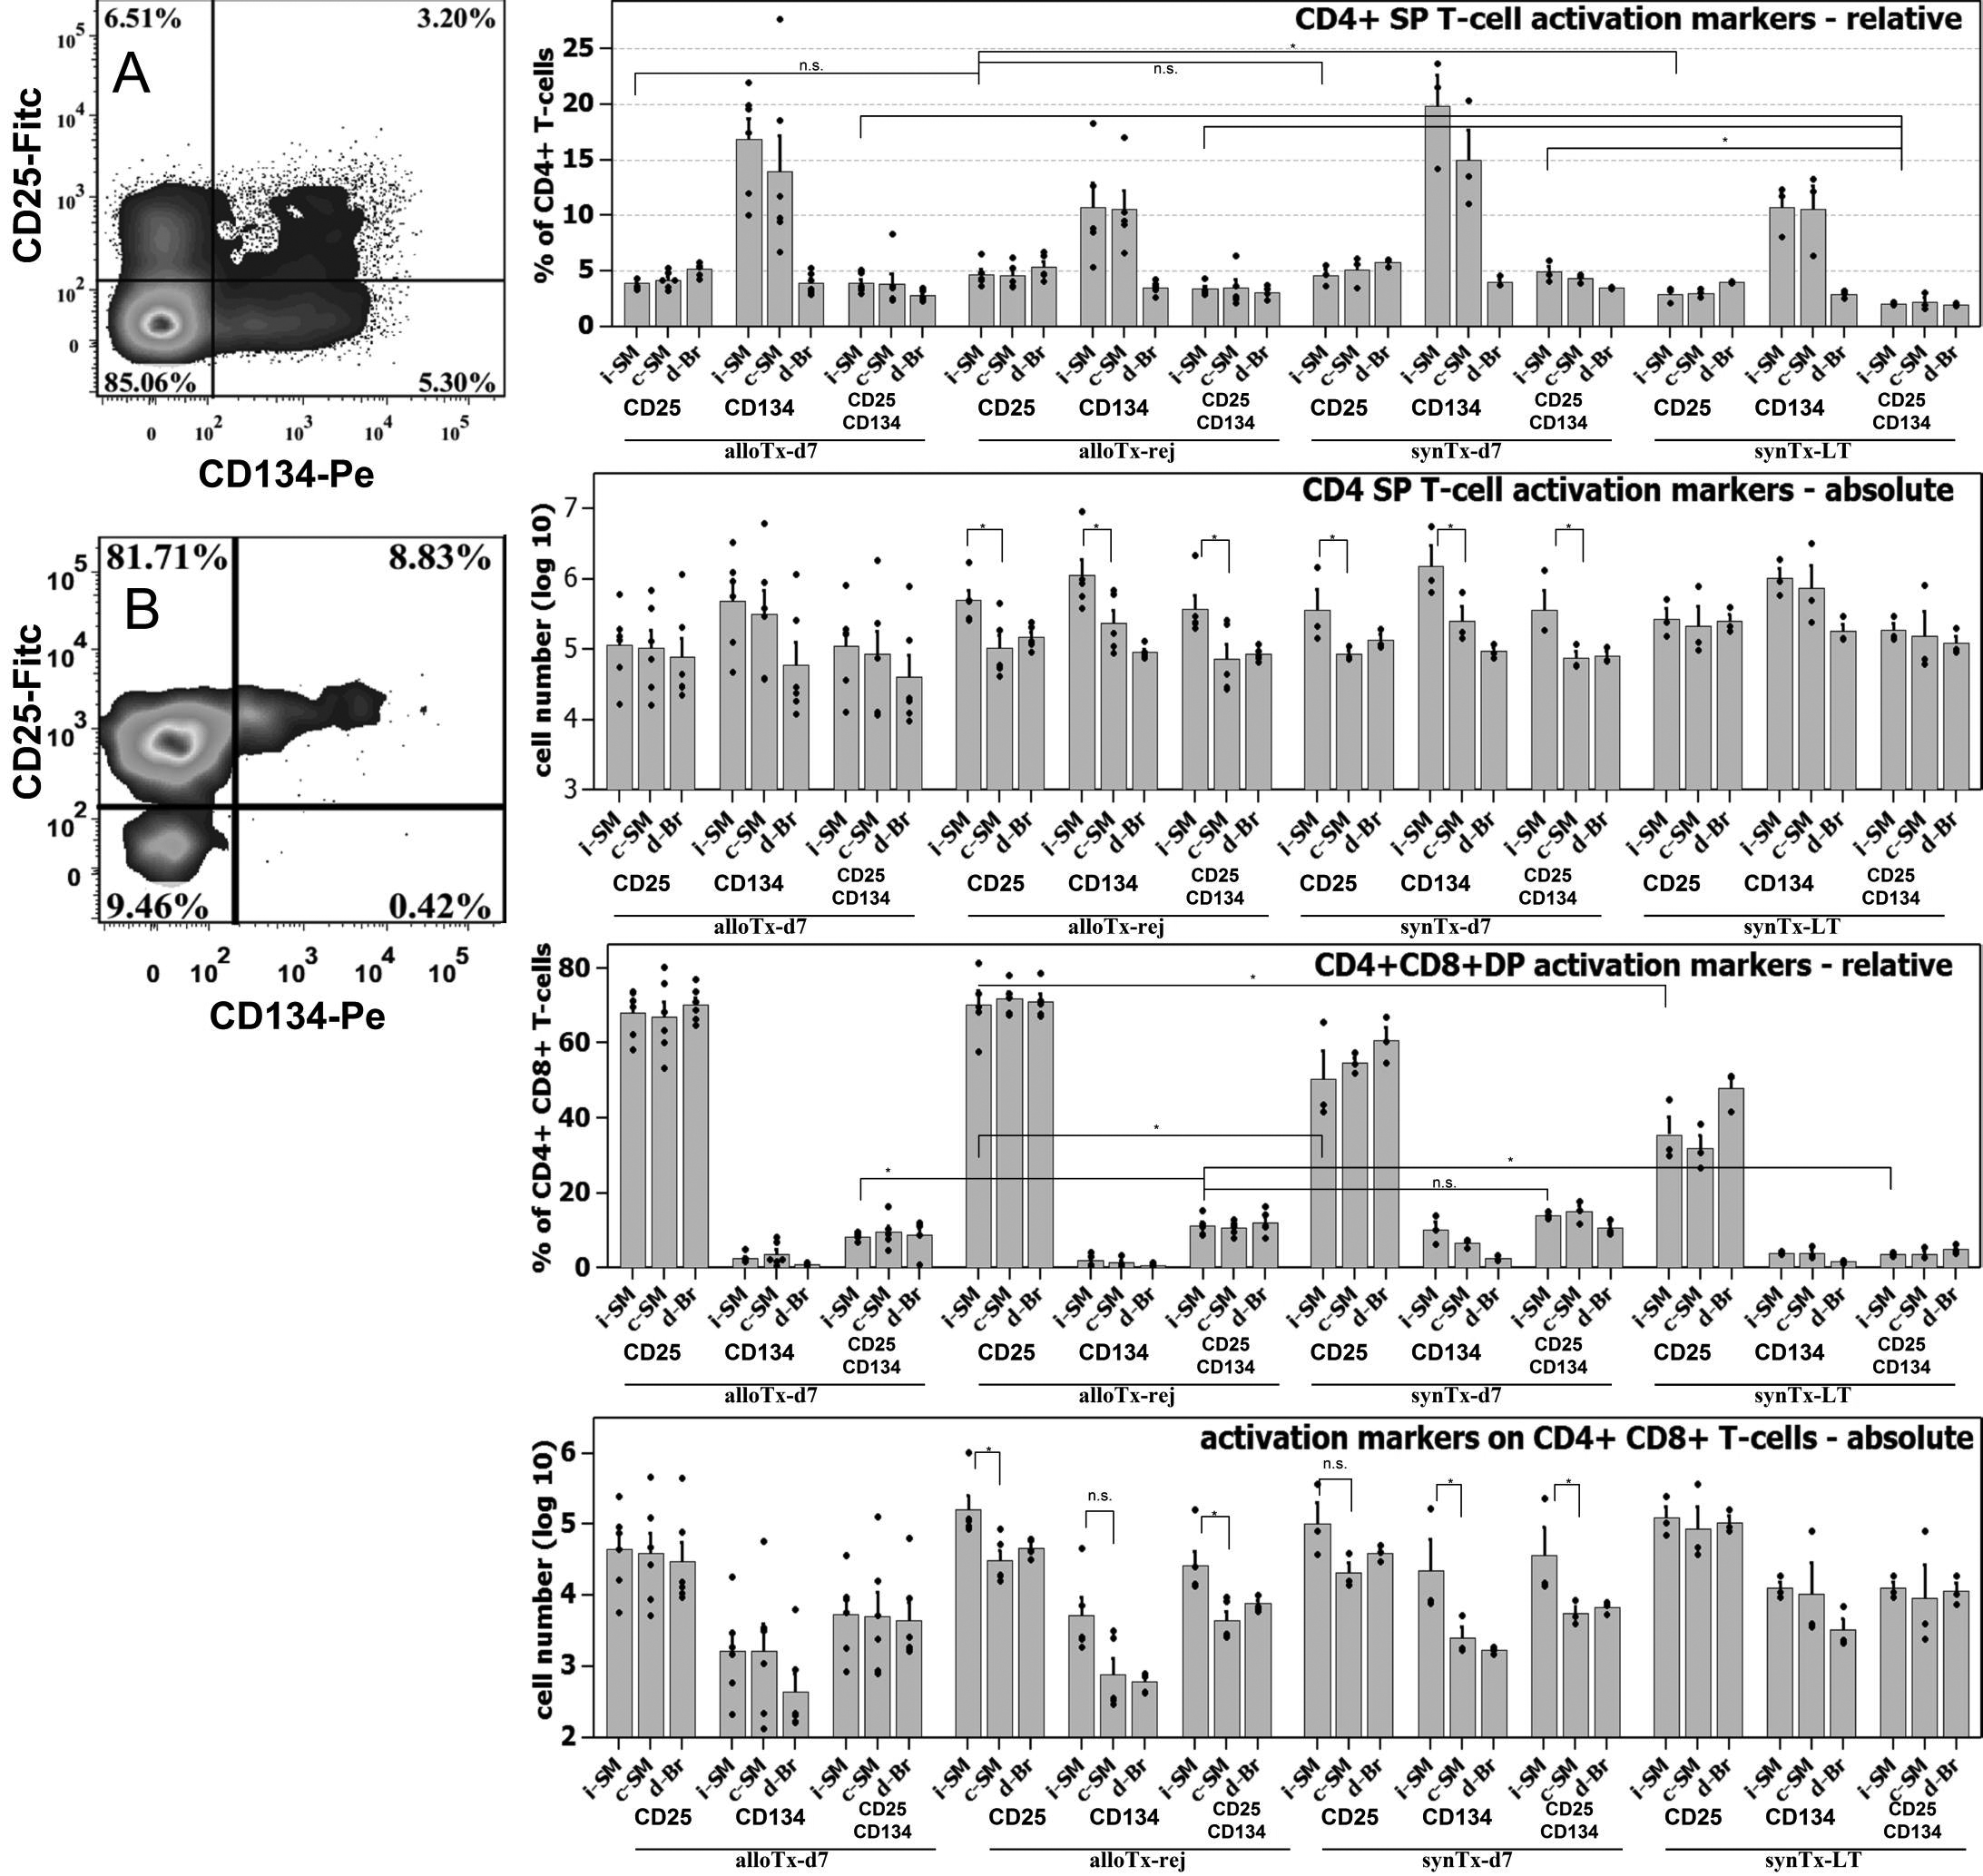
 Figure 3 of Maenz, Mol Vis 2011; 17:420-429.