Figure 2. Qualitative and quantitative
flow cytometric analysis of lymphocyte populations in draining lymph
nodes. A: Representative FACS plot of CD4+ CD8+ staining used
to count T-helper cells, cytotoxic T-cells and CD4+ CD8+ double
positive T-lymphocytes. Events acquired: 2×10⁵. B:
FACS plot example for B-cell detection. C: Representative FACS
plot for NK cell assessment. NK-T cell were confirmed by CD3 expression
(not shown). Bar diagrams: Cumulative results for the quantification of
major and minor lymphocyte populations in draining LN of cornea
transplanted animals. An asterisk (*) indicates statistical
significance at p≤0.05 determined by Mann–Whitney U-Test. Allo-Tx-d7 -
animals allo-grafted and analyzed at day 07 post op, n=6; allo-Tx-rej –
animals displaying allo rejection of grafted corneas analyzed after the
onset of rejection, n=5; syn-Tx-d7 – syngeneically grafted animals
analyzed at day 7 post-op, n=3; syn-Tx-LT – syn-grafted long-term
survivors analyzed at the end of the observation period at day 42; n=3.
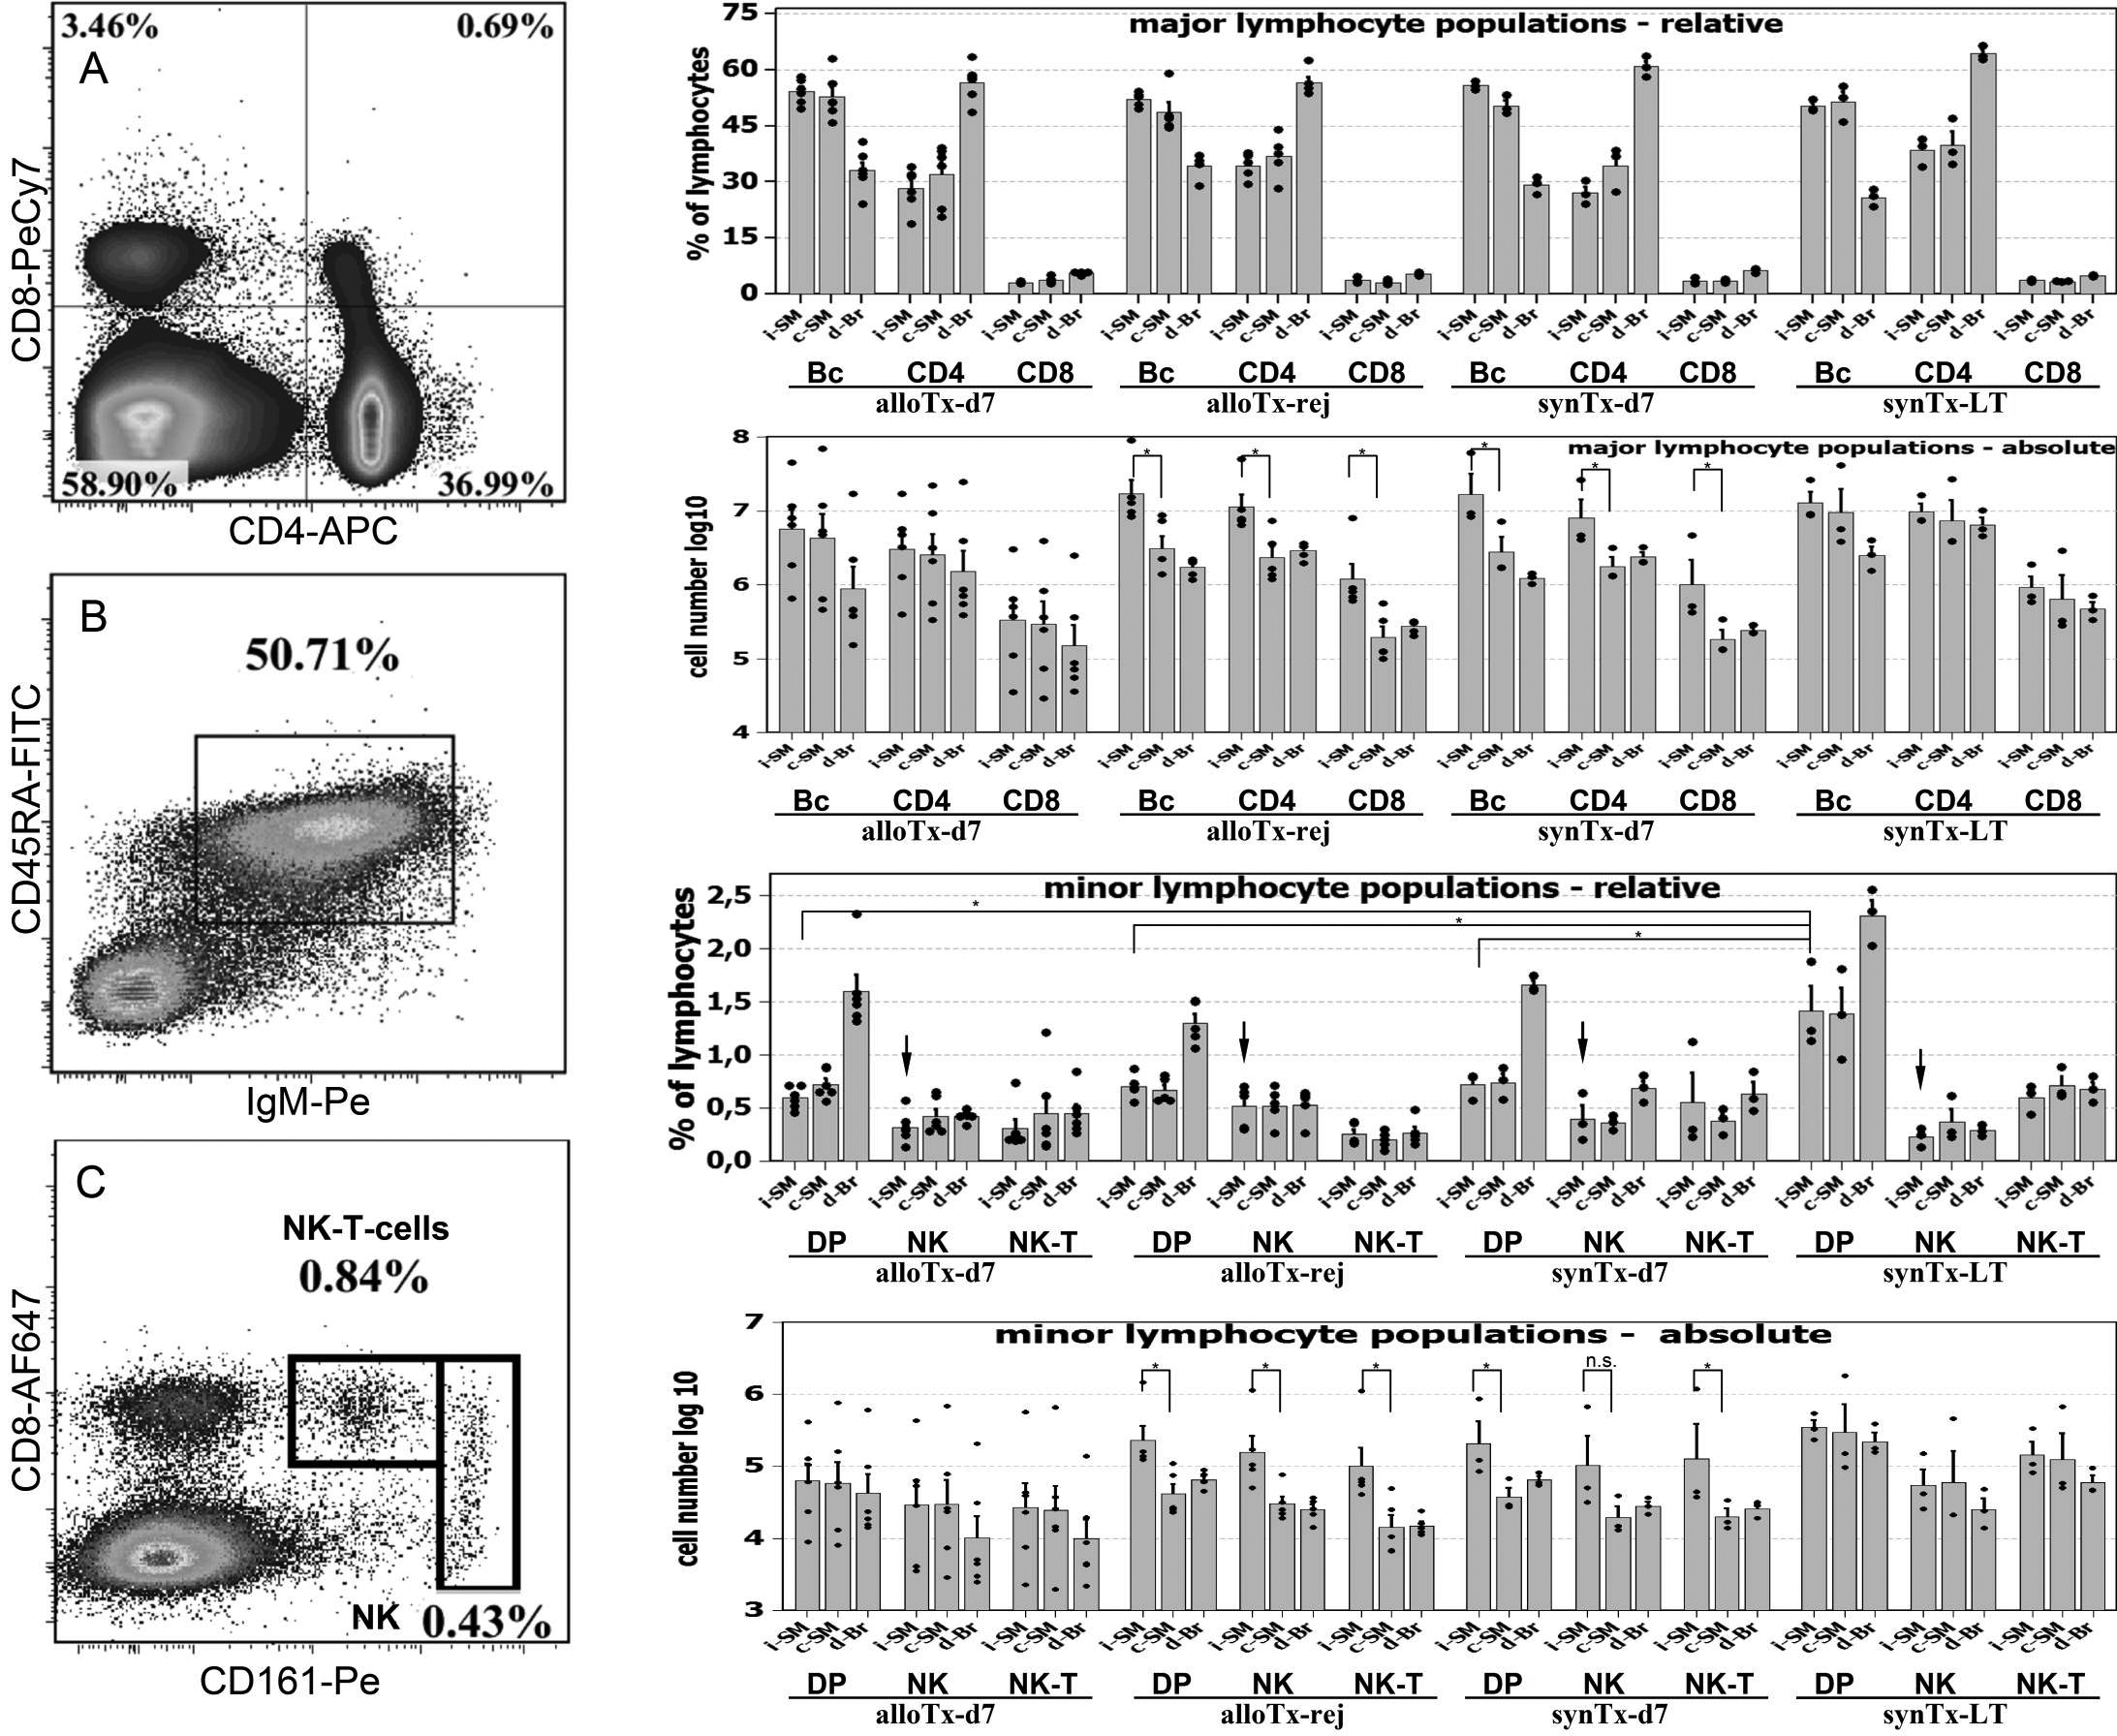
 Figure 2 of Maenz, Mol Vis 2011; 17:420-429.